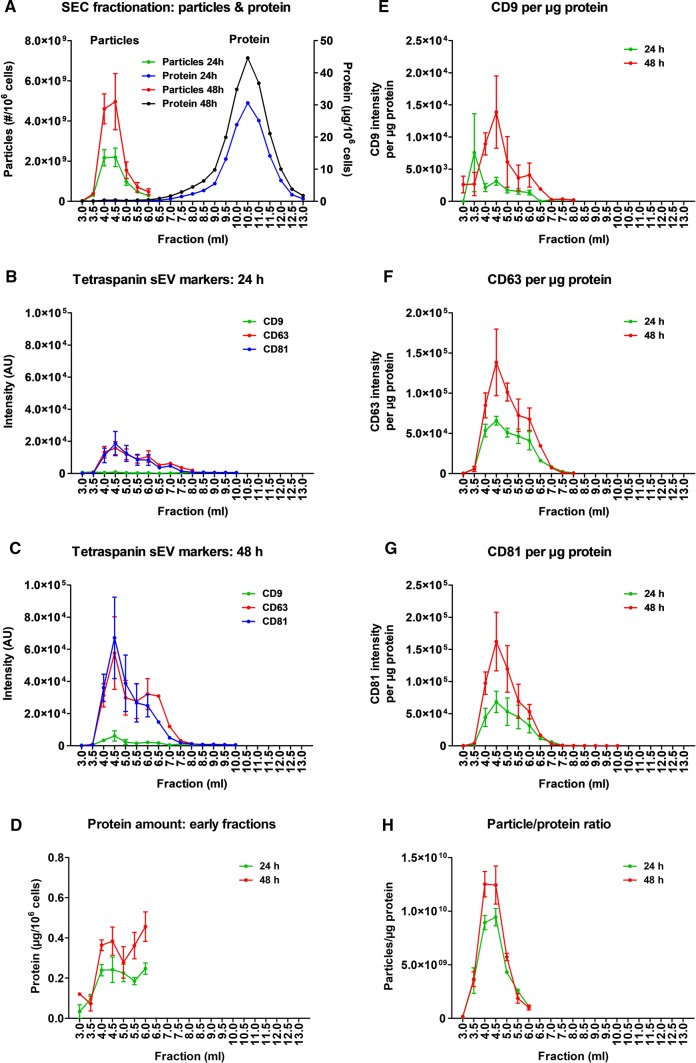
Fig. 2.
Characterisation of SS-hAFSC sEVs after different incubation timings. sEVs were isolated by SEC of serum-free medium conditioned by SS-AFSCs for 24 h or 48 h. a Particle and protein levels of SEC fractions measured by NTA and BCA assays, respectively. p < 0.01 for Particles 24 h vs Particles 48 h. b, c Exosome-specific tetraspanin markers of SEC fractions obtained from 24 h (b) or 48 h (c) incubation of SS-AFSCs measured by DELFIA. p < 0.01 for CD9; p < 0.001 for CD63 and CD81. d Protein amount of early SEC fractions. Note the low protein quantities and the early protein peak. p < 0.001. e, g CD9 (e), CD63 (f), and CD81 (g) signal of SEC fractions normalised to protein amount. p < 0.05 for e; p < 0.01 for g; p < 0.001 for f. h Particle/protein ratio of early SEC fractions. p < 0.05. n = 3 where error bars are present and n = 1 where absent. Curves compared by two-way repeated-measures ANOVA (points with n = 3 included)

