Fig. 3.
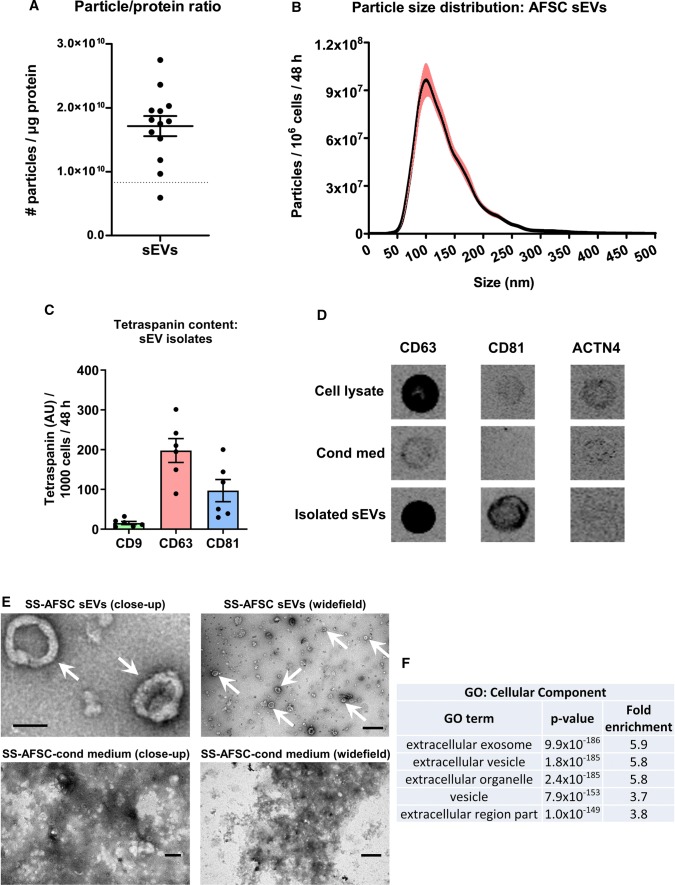
Characterisation of pooled SS-hAFSC sEVs. sEVs were isolated by SEC of serum-free medium conditioned by SS-hAFSCs for 48 h and sEV-rich fractions were pooled and analysed. a Particle/protein ratio. n = 13. Dotted line–theoretical ratio of 8.3 × 10⁹ particles/µg protein reported for a pure population of sEVs [19]. b Particle-size distribution of SS-hAFSC sEVs. n = 25. Red lines represent SEM. c Levels of tetraspanin exosome-specific markers CD9, CD63, and CD81. n = 6. d Dot blots for CD63 and CD81 and ACTN4 (alpha-actinin-4—medium/large EV-specific marker). e TEM images of SS-hAFSC sEVs and SS-hAFSC-conditioned medium. Arrows point to sEVs. Scales: top left—100 nm; top right—500 nm; bottom left—200 nm; bottom right—1 µm. F: Functional enrichment analysis of the proteins in SS-hAFSC sEVs. The top 5 gene ontology (GO) cellular component terms are shown

