Fig. 8.
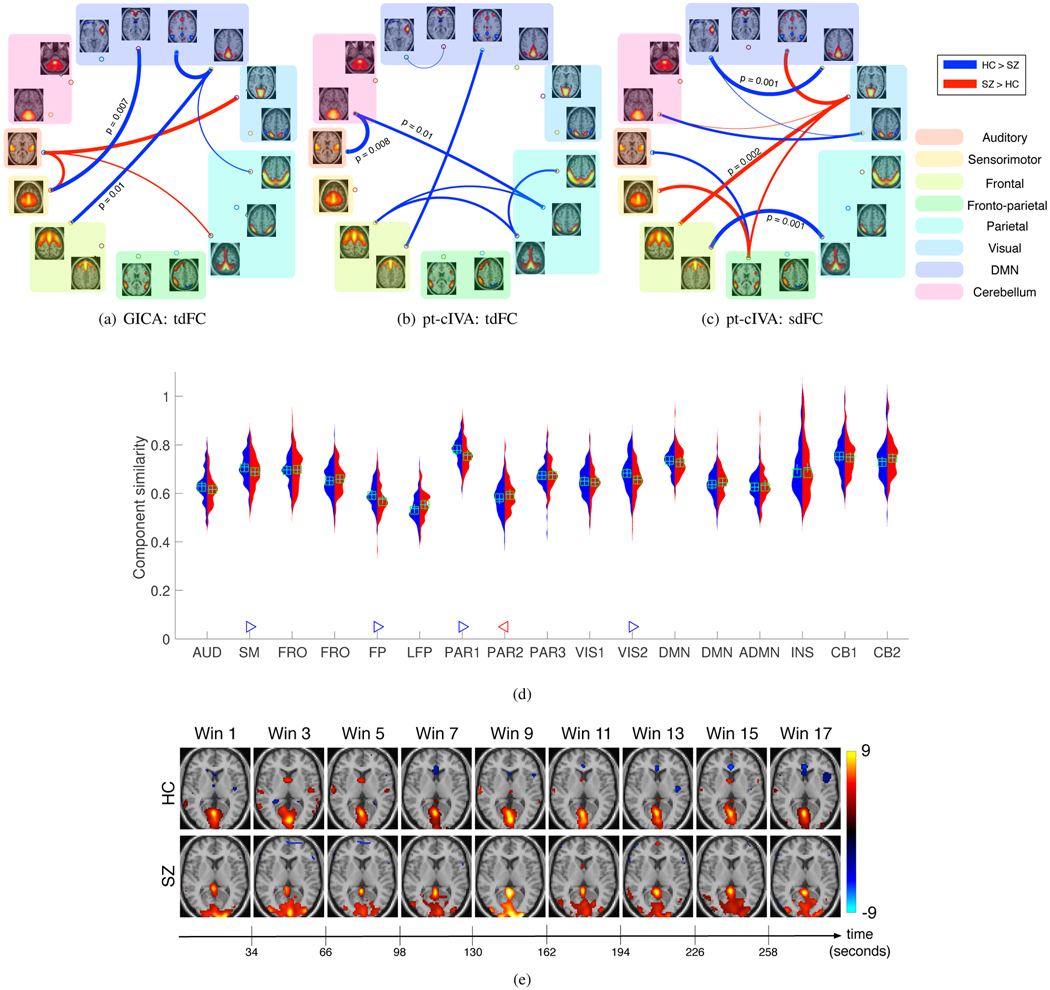
(a-c) Associations that demonstrate significant difference (p < 0.05, corrected) between HC and SZ group. Blue connections indicate higher measures in controls whereas red indicates higher measure in patients. Thickness of the connection indicates a more significant difference (lower p-value) between HCs and SZs. More group differentiating and relevant connections with significantly lower p-values are obtained using the proposed method as compared with GICA. (d) Component similarity of all components. Red indicates the distribution of this metric for the SZ group and blue indicates the distribution of this metric across HC group. Components that demonstrate significant difference (p < 0.05, corrected) between HC and SZ group are indicated by a triangle. A blue ’▷’ denotes the corresponding component is less variable in the HC group whereas a red ‘◁‘ denotes the corresponding component is less variable in the SZ group. The results indicate that SM, FP, PAR1, and VIS components are less variable in HC whereas PAR2 is less variable in SZ group. (e) Changes in the visual component (VIS1) for one subject corresponding to lowest variability within the HC group and SZ group. The visual component shows disrupted activation pattern for the SZ subject as compared with the HC subject.

