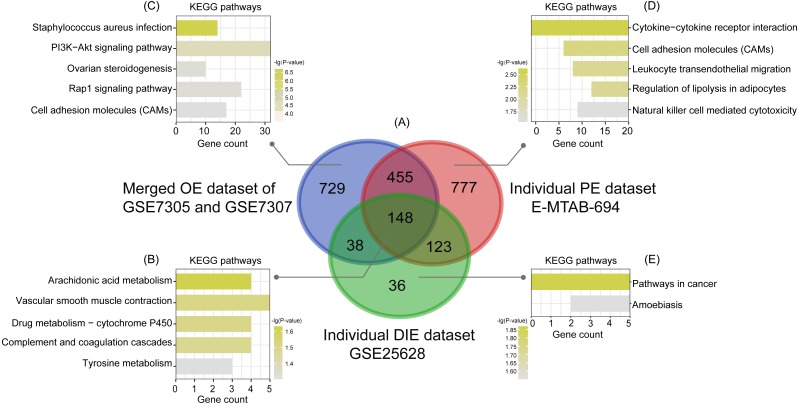
Figure 3. Intersection analysis and KEGG pathway enrichment analysis of common and specific DEGs among OE, PE, and DIE.
(A) Venn diagram of DEGs selected with —log2FC—>1 and p-value < 0.05 from the merged OE dataset of GSE7305 and GSE7307, the individual PE dataset E-MTAB-694 and the individual DIE dataset GSE25628. These three datasets showed an overlap of 148 genes; (B) significantly enriched KEGG pathways of 148 shared DEGs; (C) significantly enriched KEGG pathways of 729 DEGs specific to the merged OE dataset of GSE7305 and GSE7307; (D) significantly enriched KEGG pathways of 777 DEGs specific to the individual PE dataset E-MTAB-694; (E) significantly enriched KEGG pathways of 36 DEGs specific to the individual DIE dataset GSE25628. All the entries were screened out with the p-value <0.05 and ranked by p-value.

