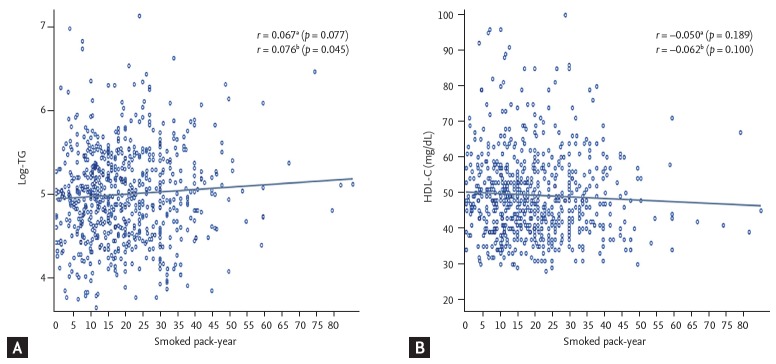
Figure 3.
(A, B) Correlation between smoked pack-years and lipid levels among current smokers. TG, triglyceride; HDL-C, high-density lipoprotein cholesterol. aUnadjusted Pearson’s correlation coefficient. bAdjusted Pearson’s correlation coefficient, adjusted for age, body mass index, systolic blood pressure, fasting glucose, physical activity, and intake of energy, carbohydrate, and fat.

