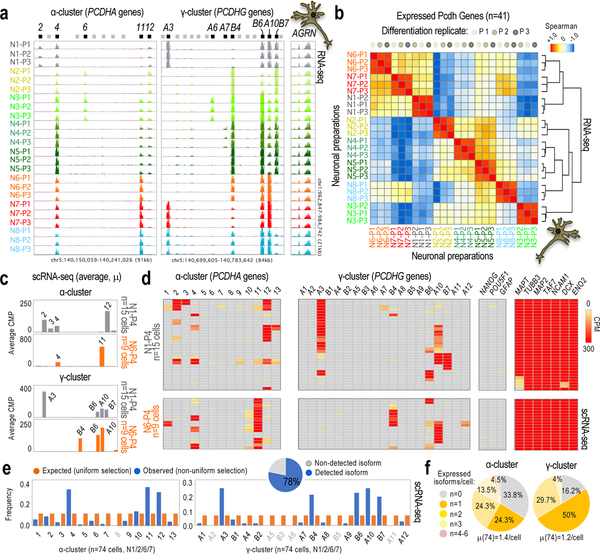
Fig. 1: Non-uniform probability of cPcdh selection in hiPSC-derived neurons.
a, RNA-seq data showing α/γ-cPcdh expression in three independent differentiation replicates (n=3, P1–P3) of neurons generated from NPCs derived from n=8 different single-cell-derived hiPSC subpopulations (hiPSC1–8). AGRN expression shown as reference. Expressed/non-expressed 5’ α/γ-cPcdh exons indicated (black and grey bars, respectively). Genomic coordinates: hg18. Scale: identical in all tracks. See some quantifications in Supplementary Fig. 1c. b, Hierarchical clustering (Spearman-rank correlation) and correlation matrix analyses based on expressed cPcdh genes in at least one neuronal preparation (n=41 out of 48) based on a (5’-exon-only signal). Analysis shows co-segregation of differentiation replicates in cPcdh expression. Color code: maximum (+1) to minimum similarity (−1). c,d, Expressed α/γ-cPcdh genes in n=15 single N1 cells and n=9 single N6 cells from a fourth differentiation replicate (P4). Data based on scRNA-seq (counts per million, or CPM). Data shown as an average of single cells (in c) or as individual cells (in d). Comprehensive heatmap shown in Supplementary Fig. 3a. Markers: pluripotency (NANOG and POU5F1), glial (GFAP), and neuronal (MAPT, TUBB3, NCAM1, DCX, and ENO2) genes. e, Observed (non-uniform) versus expected (uniform) distribution of random cPcdh selections in single hiPSC-derived neurons (combining n=15 N1, n=38 N2, n=9 N6, and n=12 N7 cells; scRNA-seq in Supplementary Fig. 3a). X2-test, P-value=2.2e-16. The pie graph represents the fraction of α/γ-cPcdh isoforms (out of n=48) detected in at least one single neuron (n=74 cells). f, Number and average (μ) of expressed α/γ-cPcdh isoforms by neuron (scRNA-seq, n=74 cells).

