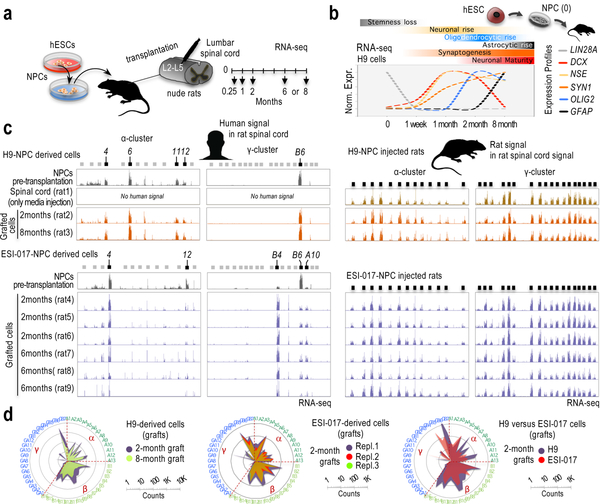
Fig. 5: Signs of hESC-guided cPcdh signatures are remarkably stable in vitro and in vivo.
a, Experimental scheme. b, Relative and normalized RNA-seq signal in H9-derived NPCs prior transplantation (“0”, n=2 samples) and in grafted cells after transplantation, 1 week or 1/2/8 months, as indicated (one rat at each time point). Profiles normalized to 1 (maximum expression for each gene). RNA-seq values and additional genes are shown in Supplementary Fig. 18a. Markers: LIN28A (NPC identity); ENO2 (neuronal identity); DCX (early postmitotic neurons); SYN1 (synaptogenesis); GFAP (astrocytic identity); and, OLIG2 (oligodendrocytic identity). c, RNA-seq signal along the human α-cluster (first column) and γ-cluster (second column), and along the rat α-cluster (third column) and γ-cluster (fourth column) in H9-NPC engrafted cells and surrounding rat cells in the spinal cord, respectively (top) and ESI-017-NPC engrafted cells and surrounding rat cells in the spinal cord, respectively (bottom). Rat and human reads were computationally separated and independently aligned to the rat and human genomes, respectively. Samples: hESC-derived NPCs prior transplantation (n=2), media-only-injected spinal cord (n=1), and 2, 6 or 8-month engrafted cells, as indicated (a rat at each time point in H9-NPC injected cases and n=3 rats at each time point in ESI-017-NPC injected cases). 5’ cPcdh exons indicated on top; expressed exons highlighted in black. Y-axis is adjusted to max in each track. d, Log10-scale radar plots of averaged RNA-seq signal for the n=48 stochastically selected cPcdh genes in the indicated conditions. (clockwise, in numerical/alphabetical order by clusters, color-coded in the periphery).

