
Fig. 2.
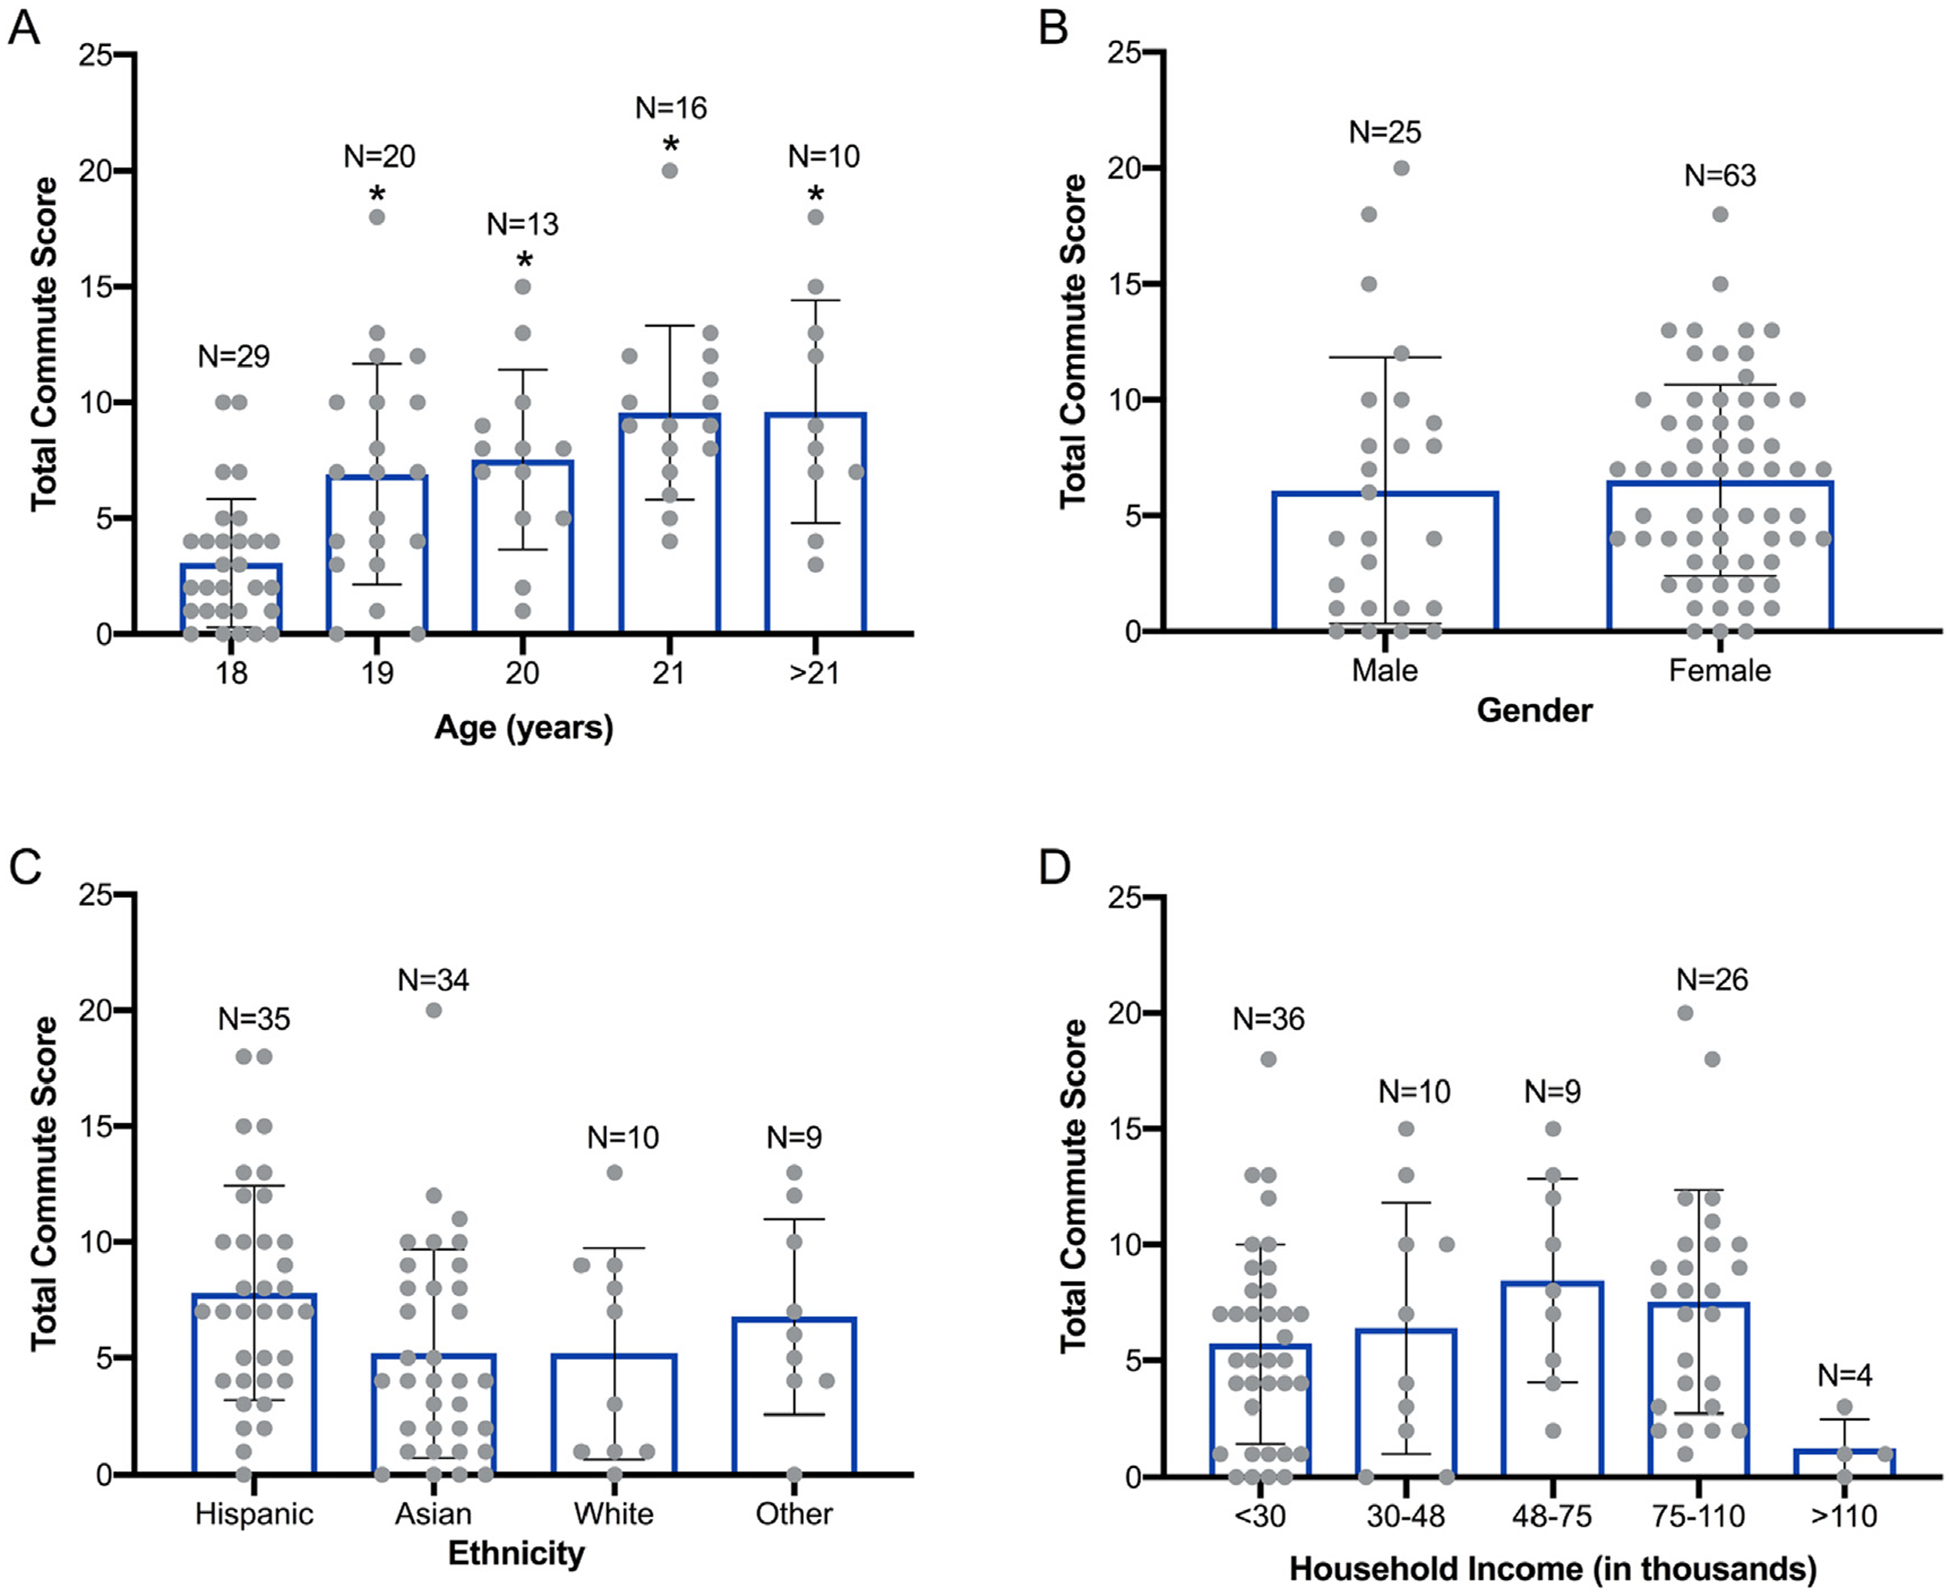
Total commute score of study participants grouped by age (A), gender (B), ethnicity (C), and household income (D). N = 88 for age, gender, and ethnicity; N = 85 for household income as a result of three participants not responding (Table S1). Asterisk (*) denotes significant difference (p < 0.05) relative to the 18-year-old age group within Panel A.