
Fig. 3.
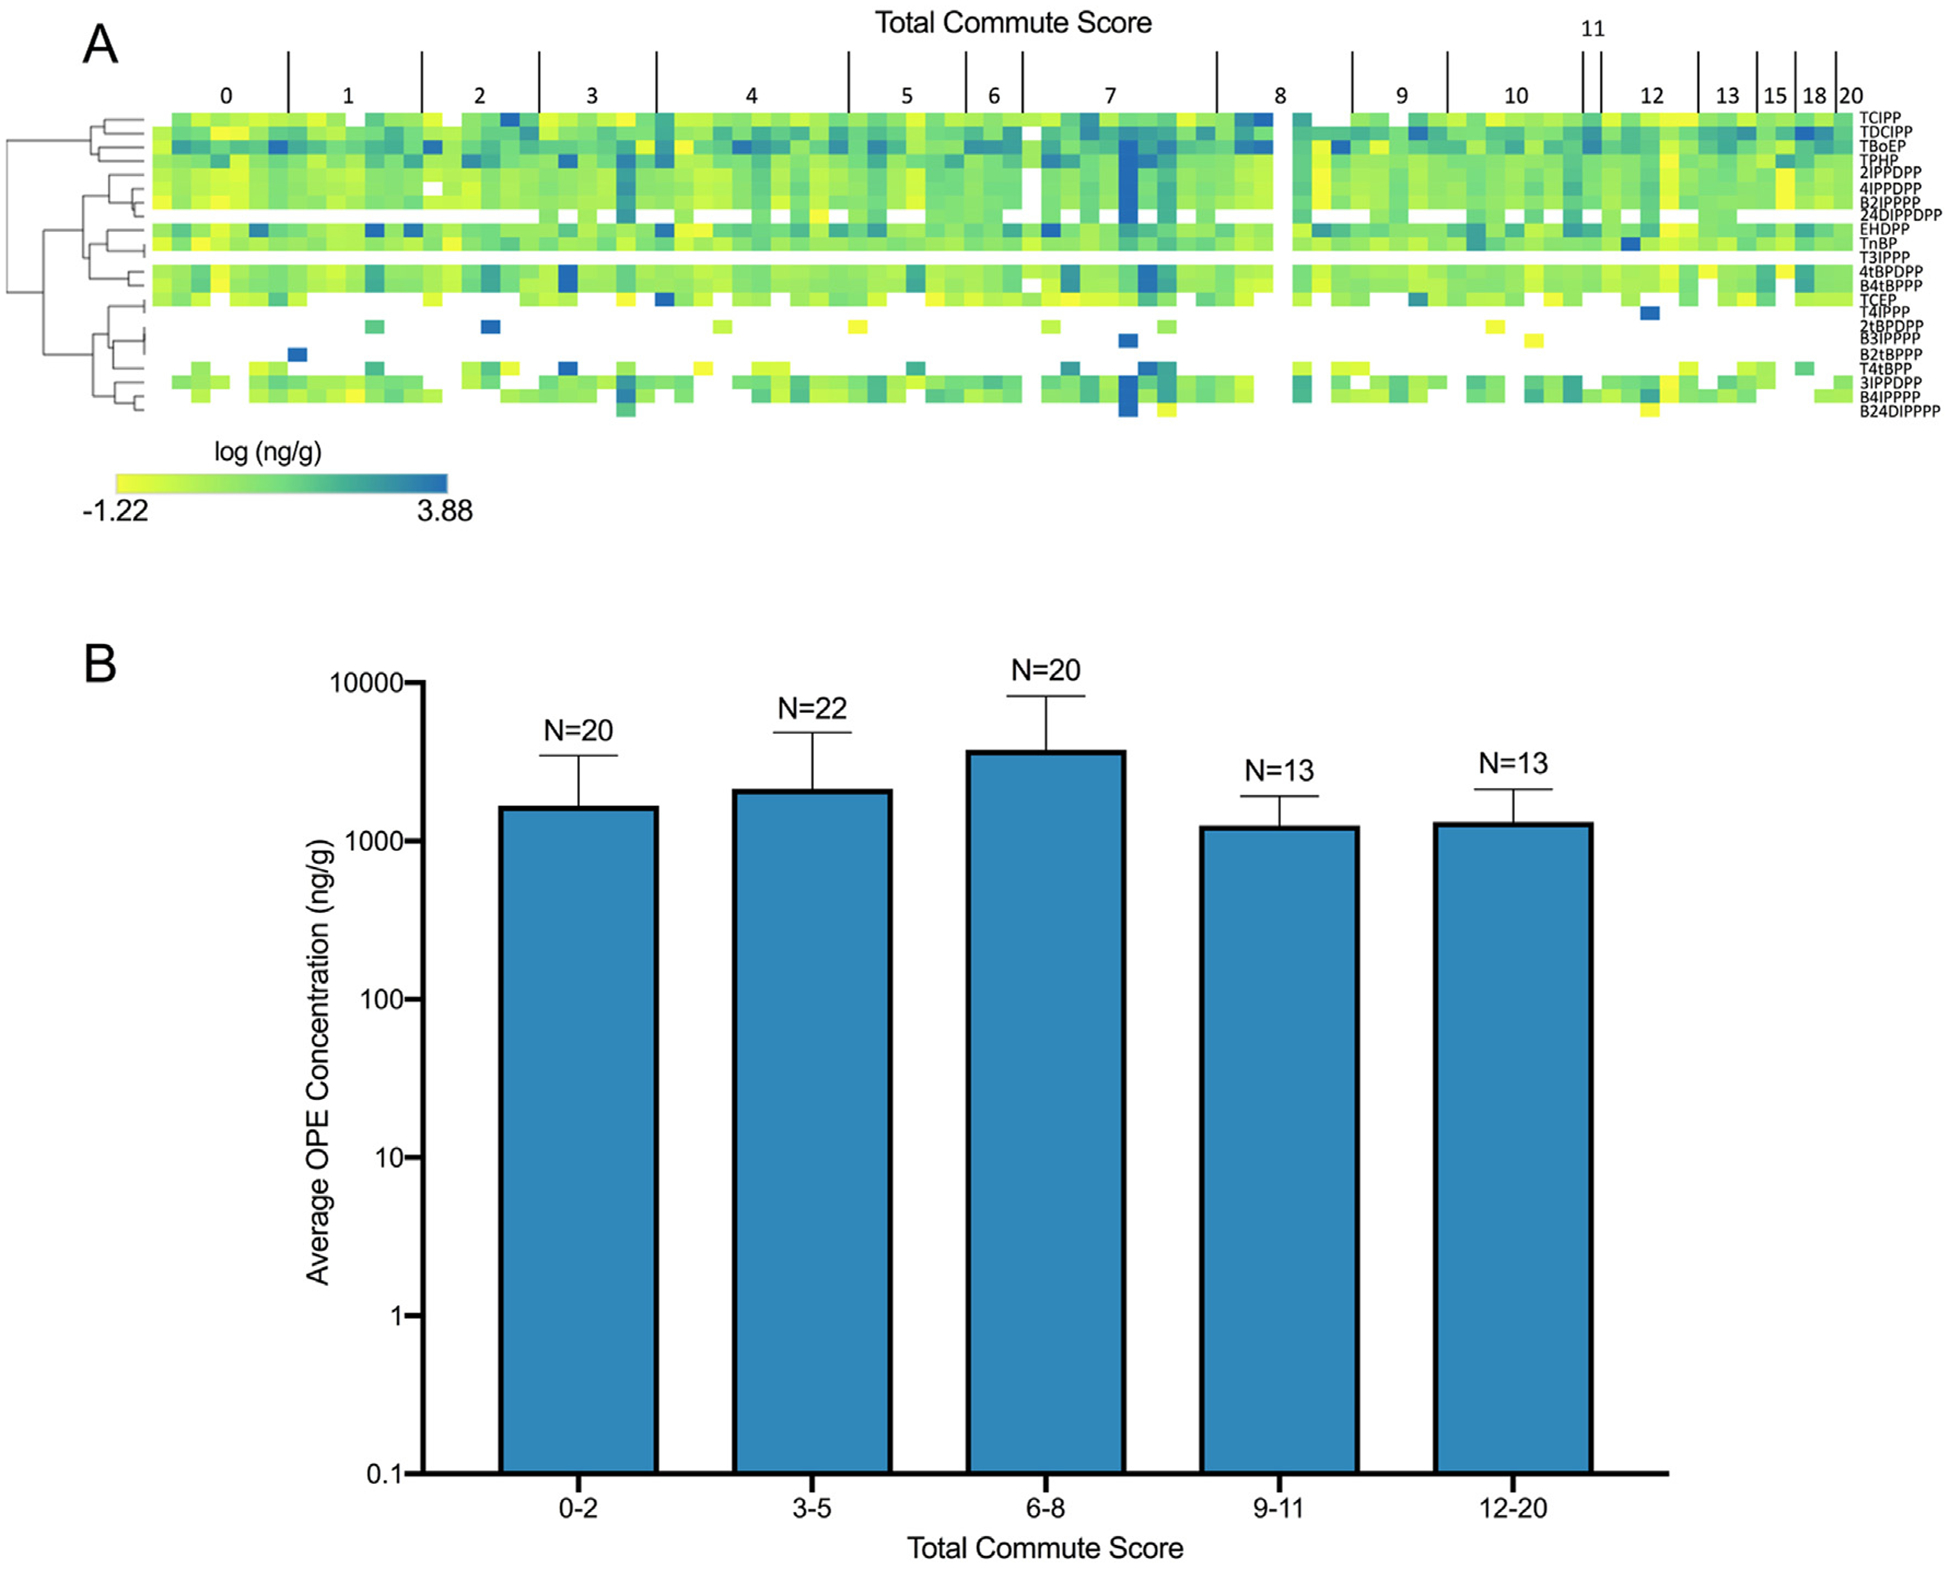
Heat map representing wristband concentrations of individual OPEs vs. total commute scores (A). OPE concentration data shown within the heat map were log10-transformed, and hierarchical clustering was performed using the Euclidean distance and complete linkage method. Average concentration (± standard deviation) of all OPEs and total commute score (B).