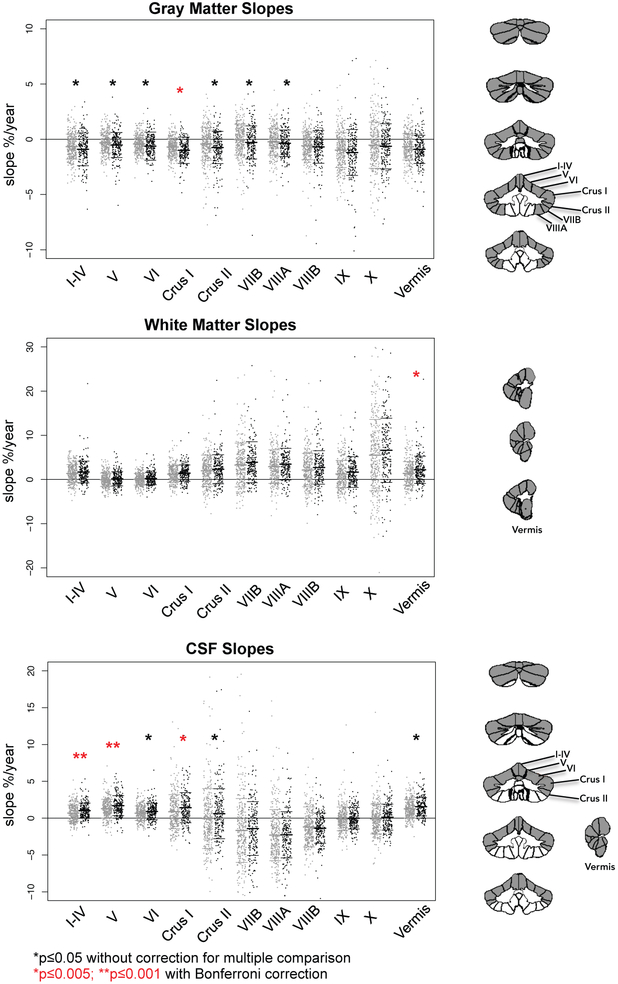
Figure 5.
Jitterplots of slopes (expressed as % change per year) by tissue type for the 328 no/low drinkers (gray) and all 220 youth who initiated moderate or heavy drinking (black). The red asterisks mark differences from the no/low drinking group in slopes meeting correction for multiple comparisons (*p≤0.005; **p≤0.001). The black asterisks note differences with p≤0.05 (also see Supplemental Figure 2). The cerebellar images to the right of the jitterplots display in gray the lobules showing group differences (p≤0.05) in slopes.

