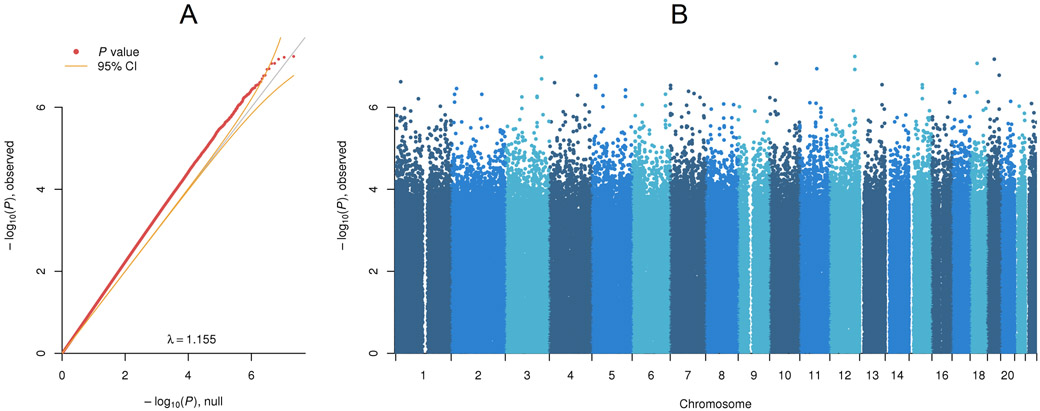
Figure 1. MWAS of baseline methylation and MDD status six years later.
(A) Quantile-Quantile plot. The main diagonal of the plot indicates the P-values we would obtain assuming none of the CpGs predict MDD status six years later (MDDYear6) with the yellow curved lines denoting the 95% confidence intervals. The red points in the QQ plot are the observed MWAS P-values. (B) Manhattan plot. The plot shows the MWAS P-values by their chromosomal location. The dashed line indicates the threshold used for inclusion of CpGs in the MRS.

