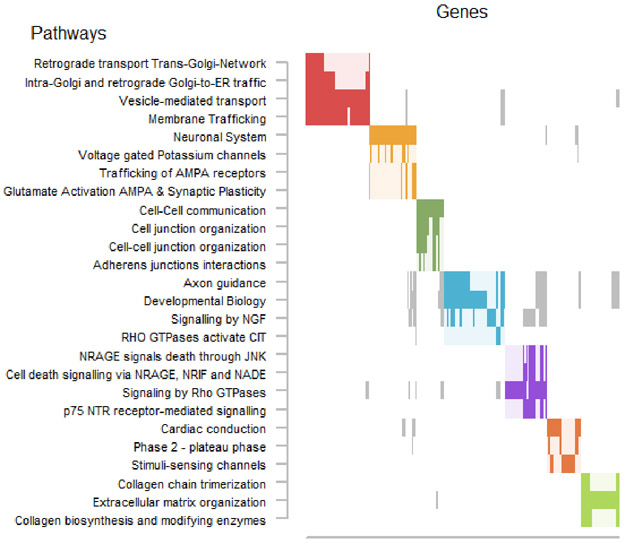
Figure 2. Summary of pathway analysis.

We only show pathways that overlapped with at least 4 top MWAS genes and yielded over-representation P-values < 0.05. Pathways often share genes. The raster plot visualizes the clustering of pathways (y-axis) as determined on the basis of their overlapping genes (x-axis). The solid rectangles indicate genes that were both among the top MWAS results and a member of the listed pathway.
