
Figure 1.
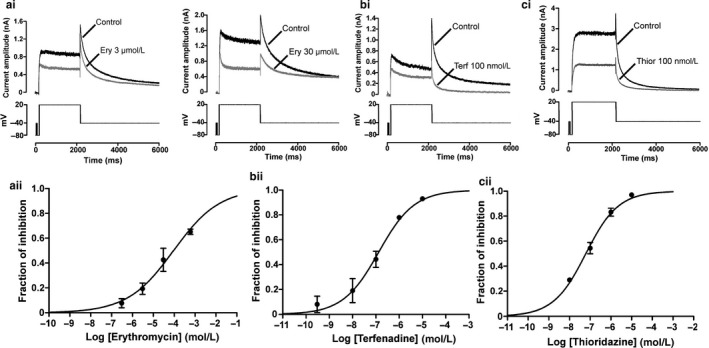
Sensitivity of IhERG to erythromycin (a), terfenadine (b) and thioridazine (c). Top panels show representative traces for IhERG recorded at 37ºC before and during exposure to 3 or 30 µM erythromycin (Ery) (ai), 100 nM terfenadine (Terf) (bi) or 100 nM thioridazine (Thior) (ci). Currents were elicited using the protocol shown in the lower panels. Bottom panels show the isochronal concentration–response relationships obtained for erythromycin (aii) (IC50 94 µM (CI 38.4–230.1 µM); n = 5 to 8 to cells per concentration), terfenadine (bii) (IC50 128.5 nM (CI 68.0–243.3 nM); n = 4 to 6 to cells per concentration) and thioridazine (cii) (IC50 62 nM (CI 52.7–73.1 nM); n = 5 to 7 cells per concentration). Respective nH values yielded from fit were of 0.40 (CI 0.25–0.54), 0.57 (CI 0.36–0.77), 0.55 (CI 0.50–0.61) for erythromycin, for terfenadine and for thioridazine