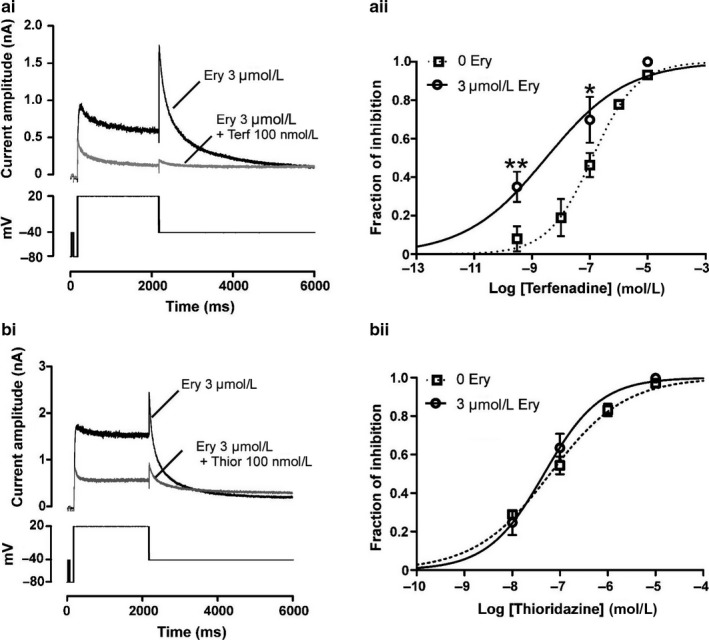
Figure 2.

Effect of a pretreatment with 3 µM erythromycin on IhERG block by terfenadine (a) and thioridazine (b). Left panels show representative current traces for effects of 100 nM terfenadine (ai) or 100 nM thioridazine (bi) on IhERG after a 15‐min preincubation with 3 µM erythromycin. Currents were elicited using the protocol shown in the lower panels. Right panels show isochronal concentration–response relationships for terfenadine inhibition of IhERG (aii) or thioridazine (bii) in the presence of 3 µM erythromycin. Fit to the concentration–response curves yielded an IC50 of 4 nM ((CI 0.63–25.6 nM); n = 5 cells per concentration) for terfenadine and 46.4 nM ((CI 36.3–59.3 nM); n = 4 to 6 cells per concentration) for thioridazine. Respective nH were of 0.30 (CI 0.14–0.47) for terfenadine and of 0.73 (CI 0.58–0.90) for thioridazine. Asterisks in Aii denote statistical significance: ** at p < .01 and *p at < .05 (two‐way ANOVA with Bonferroni post hoc test)
