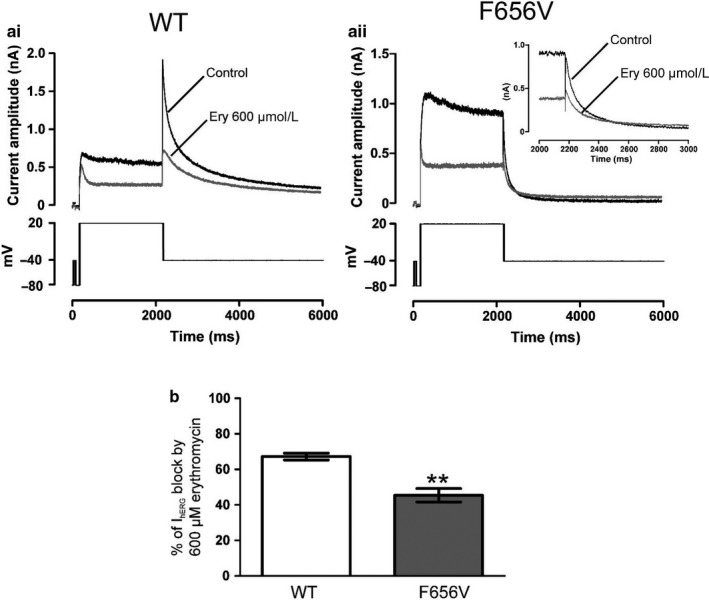
Figure 3.

Effect of mutation at F656 on IhERG block by erythromycin (a) Representative traces for WT IhERG (ai) and F656V IhERG (aii) before (control) and after exposure to 600 µM erythromycin (Ery) at 37ºC, using the voltage protocols in the panels below. (b) Bar charts comparing the level of block produced by 600 µM erythromycin of WT (white bar; n = 5) and F656V (gray bar; n = 5) IhERG tail on repolarization to −40 mV following a 2 s depolarization from −80 mV to +20 mV. Asterisks in B denote statistical significance: ** p < .01 (unpaired t test)
