Figure 4.

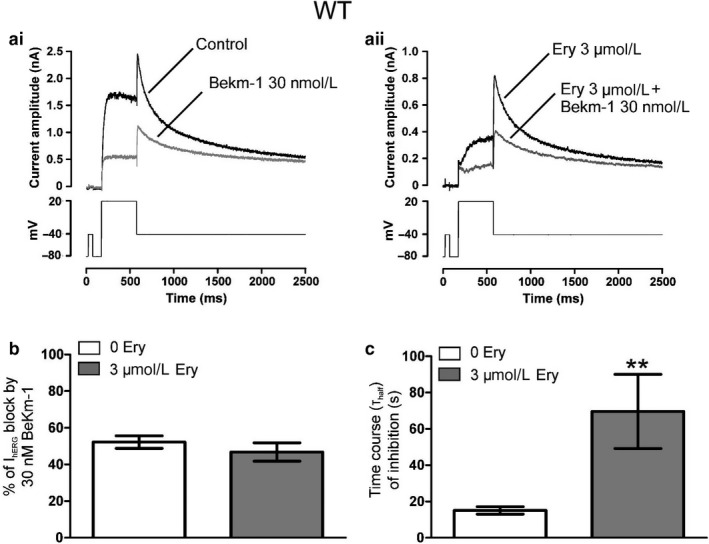
Effects of 3 µM erythromycin on IhERG tail sensitivity to 30nM BeKm‐1. (a) Representative current traces for effects of 30 nM BeKm‐1 on IhERG in the absence (ai) or after superfusion of 3 µM erythromycin (aii). Currents were elicited using the protocol shown in the lower panels. (b) Bar charts showing the level of block by 30 nM BeKm‐1 of WT IhERG tail in the absence (white bar; n = 10) and presence of 3 µM erythromycin (gray bar; n = 6). (c) Bar charts comparing thalfvalues of inhibition of WT IhERG tail in the absence (white bar; n = 10) and presence of 3µM erythromycin (gray bar; n = 6). BeKm‐1 effect on IhERG tail recorded on repolarization to −40mV was calculated as the mean fractional block and plotted against time to derive the value for time to half inhibition (thalf) of IhERG tail. ** denotes statistically significant difference from WT at p < .01 (unpaired t‐test)
