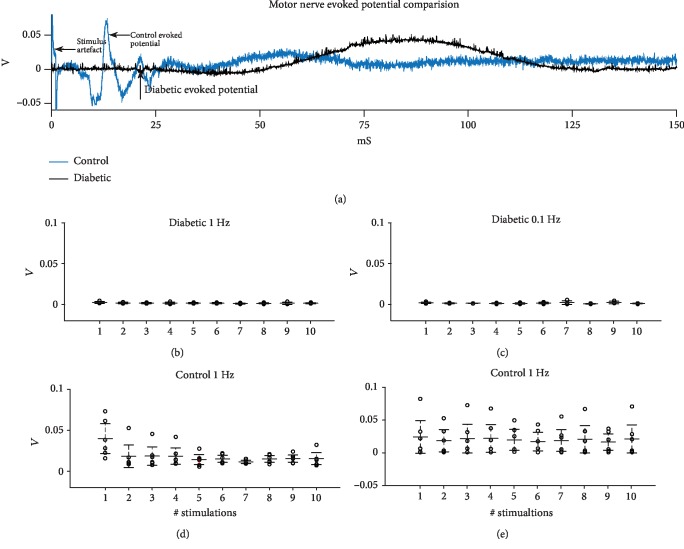
Figure 2.
Motor nerve evoked potential comparison. (a) Comparison of health control and diabetic motor nerve evoked potential. (b) Absolut peak-to-peak amplitude of diabetic animal-evoked potentials at a 1 Hz stimulation rate. (c) Absolut peak-to-peak amplitude of diabetic animal evoked potentials at a 0.1 Hz stimulation rate. (d) Absolut peak-to-peak amplitudes of control animal evoked potentials at a 1 Hz stimulation rate. (e) Absolut peak-to-peak amplitudes of control animal evoked potentials at a 0.1 Hz stimulation rate. Bars indicate means and 95% confidence intervals.

