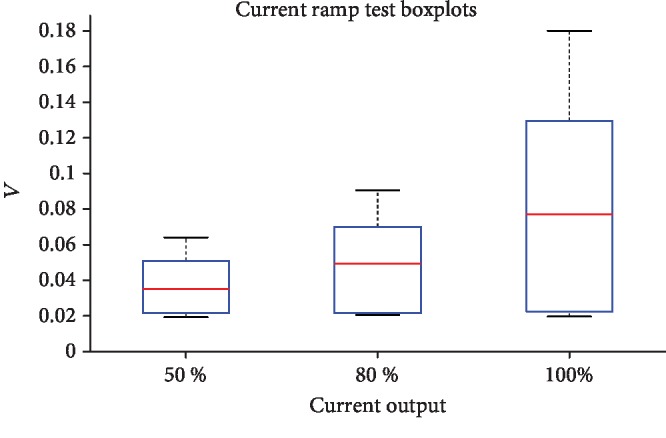
Figure 3.

Boxplots of ramp test data at the different current levels. Red lines indicate median peak-peak amplitude of evoked potential responses. Boxes represent 25th and 75th percentiles and whiskers indicate the full extent of the data for each current level.
