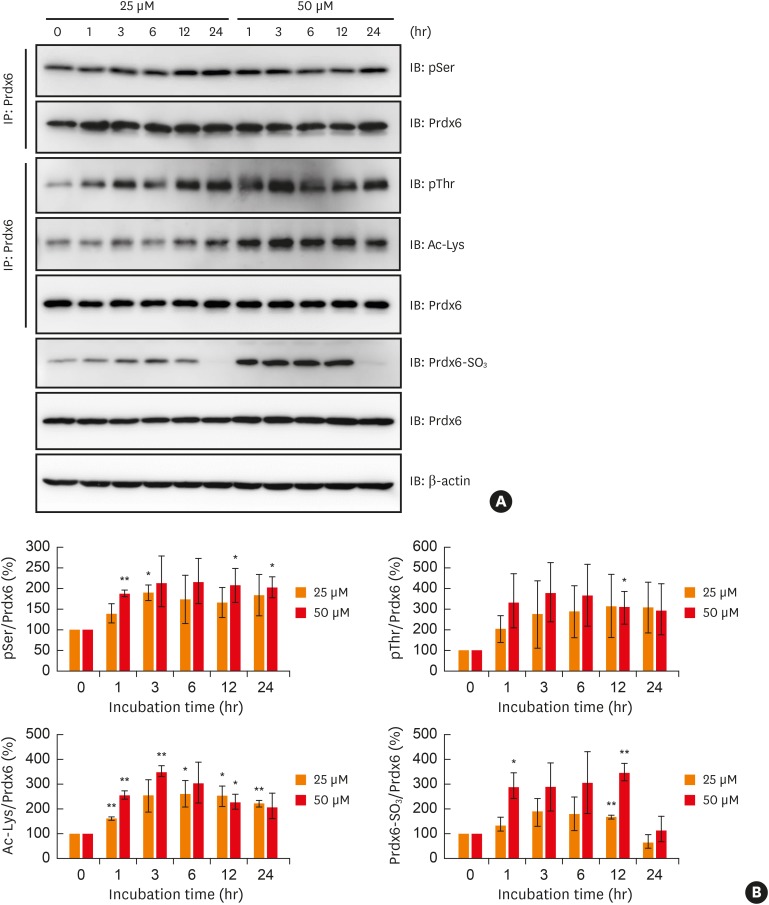
Fig. 3. Analysis of oxidative stress-induced modifications Prdx6 in BEAS-2B cells. (A) BEAS-2B cells were treated with 25 μM or 50 μM hydrogen peroxide for indicated times. Phosphorylated serine or threonine residues, acetylation, and oxidation of Prdx6 were analyzed using the indicated antibodies. (B) The quantified data from (A) are presented as a graph. Each ratio of pSer, pThr, Ac-Lys, and oxidized Prdx6/Prdx6 in mock control was set as 100%. Values are the mean ± standard deviation (n = 3).
Prdx, peroxiredoxin; IB, immunoblotting; IP, immunoprecipitation.
*P < 0.05, **P < 0.01 vs. mock control.

