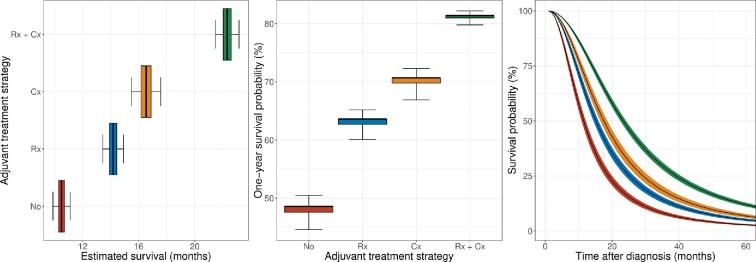
FIGURE 3.
Estimated survival profile of a hypothetical patient (male, 50-yr old, white, non-Hispanic, married, insured, left-sided, frontal lobe, confined to its primary location, 50 mm in size, gross-total resection), plotted per adjuvant treatment strategy. Personalized estimates of overall survival in months (left), 1-yr survival probability (middle), and 5-yr survival curves (right) as predicted by the accelerated failure time model. The boxes and whiskers in the boxplots represent the 50% and 95% CI, respectively. The ribbons in the survival curves represent the 95% CI. Abbreviations: Rx, radiotherapy; Cx, chemotherapy.

