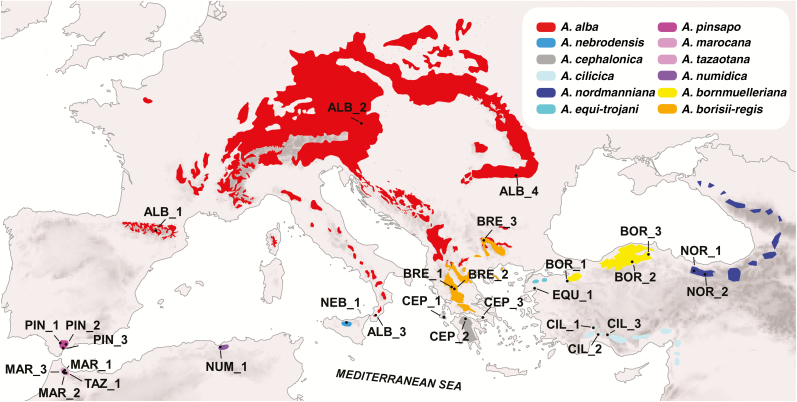
Fig. 1.
Sampling map for the Mediterranean firs used in this study. Each population is labelled and species ranges are highlighted with different colours (more information is given in Supplementary Data Table S1). Species distributions are based on the EUFORGEN project (http://www.euforgen.org/) and personal observations.

