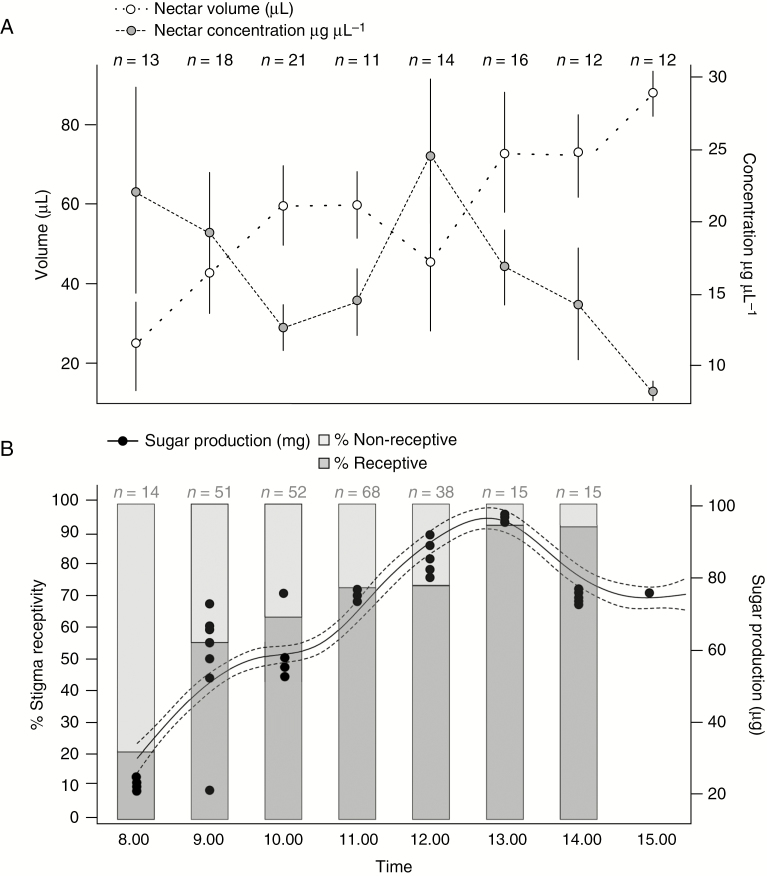
Fig. 2.
(A) Nectar volume and concentration over time in a random sample of flowers in a natural population of Lepechinia floribunda. (B) Percentage of receptive and non-receptive stigmas and sugar production (nectar volume × nectar concentration). Sample size per harvest is indicated above each hour. Non-parametric regression analysis and a cubic spline adjustment were performed to show the sugar production pattern through time. Dotted lines show ±1 Bayesian standard error interval.

