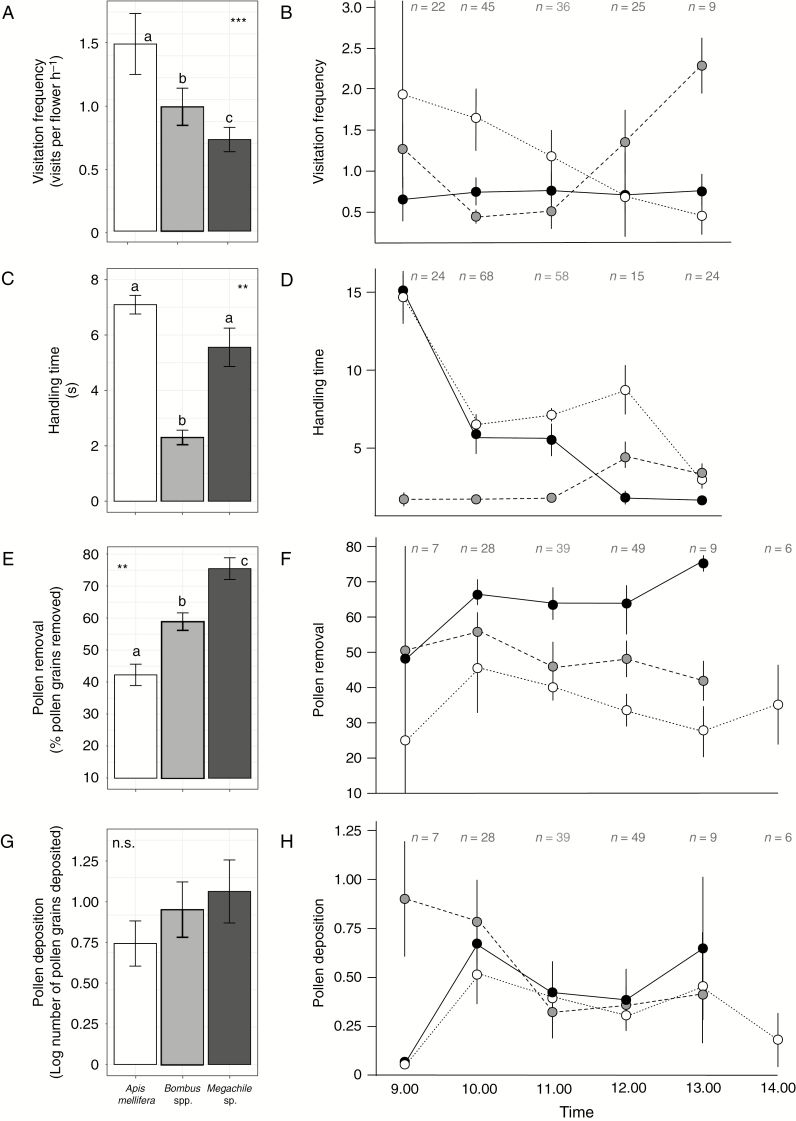
Fig. 3.
Components of pollination performance for Apis mellifera, Bombus spp. and Megachile sp. in Lepechinia floribunda. Left panels represent average values and right panels correspond to the per hour estimates. (A and B) Visitation frequency, (C and D) handling time, (E–F) pollen removal (difference in the number of pollen grains recorded between non-visited and visited flowers expressed as a percentage) and (G and H) pollen deposition (logarithm of the difference in the number of pollen grains on the receptive inner blades of the stigmatic lobules among visited flowers). Vertical lines within the left panels represent the s.e. Sample size per hour of data recording is indicated above each hour. n.s., non-significant difference; *P < 0.05; **P < 0.01.

