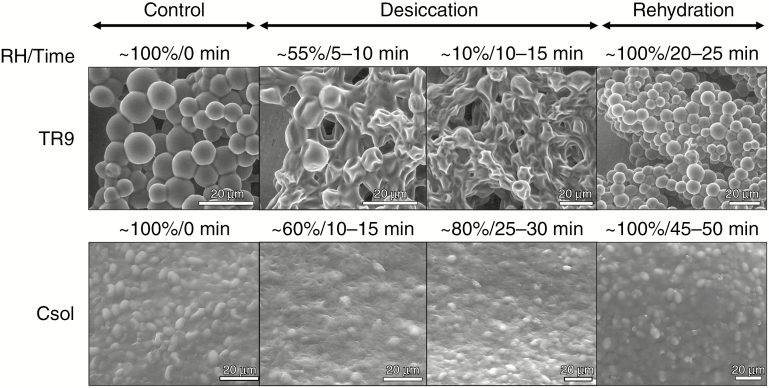
Fig. 3.
ESEM micrographs of TR9 and Csol during a D/R cycle. Algal samples were left to equilibrate at 5 °C for 15 min and then subjected to eight controlled vapour pressure purges (from 99–100 % up to 10 % and then from 10 % to 100 % RH), allowing the samples to equilibrate for several minutes at each RH level. Images in the figure depict the key stages, timing and RH conditions during a D/R cycle, including the lowest RH below which Csol did not normally rehydrate, under ESEM conditions.

