Fig. 1.
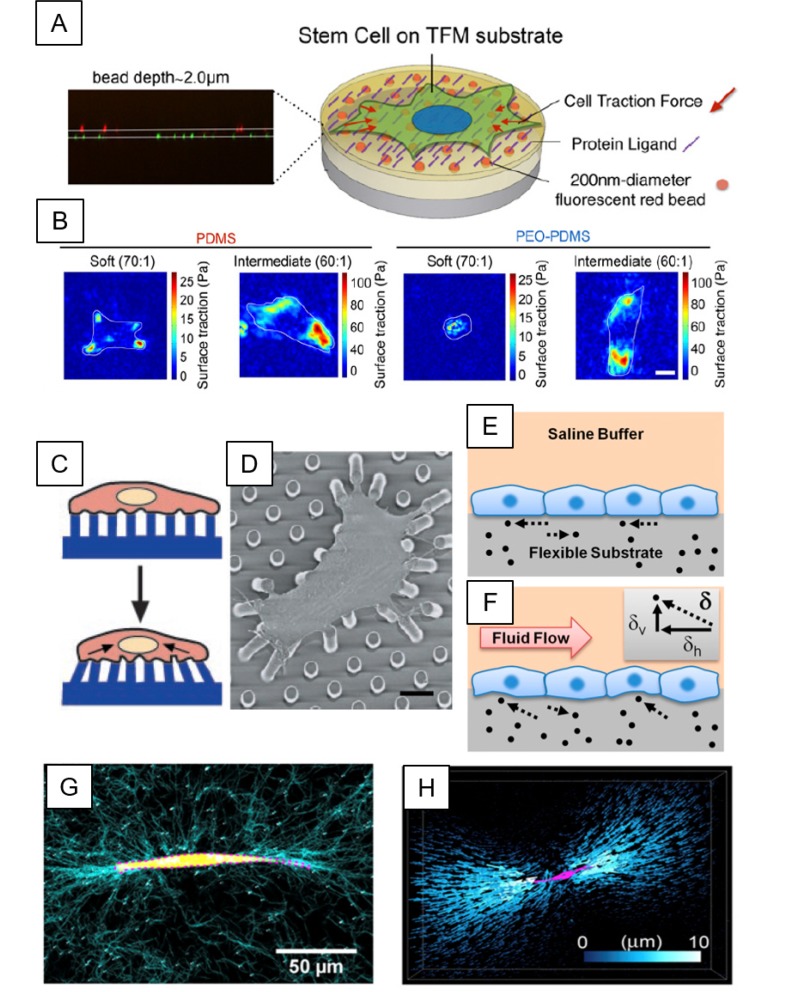
Traction force microscopy (TFM)-based cell-ECM force quantification. (A) Schematic diagram for typical TFM platform using deformable substrates, where fluorescence beads (orange dots) are embedded. Cells can adhere to the substrate through surface-conjugated ECMs or protein ligands (purple line). Traction forces (indicated by red arrows) exerted by cells can cause subtle deformation of a substrate, where traction forces can be measured by tracking the displacement of fluorescent beads within the substrate. (B) Traction force stress map showing human bone marrow-derived mesenchymal stem cells adhered onto hydrophobic-polydimethylsiloxane (PDMS) and hydrophilic-PDMS with polyethyleneoxide (PEO) (PEO-PDMS), with varying stiffness ranging from 0.2-0.3 kPa (soft, 70:1) to 5-6 kPa (intermediate, 60:1). (C, D) Schematic and scanning electron microscopy (SEM) image of 2D TFM by micropillars. Vertical arrays of PDMS microposts are fabricated by a photolithography technique. Cell spreads across multiple post beds on which ECMs are pre-coated. Adhered cells can exert traction forces. Traction forces are calculated from the deflection and material property (spring constant) of microposts. (E, F) Schematic representations of traditional 2D TFM method (E) and novel 3D TFM method (F). 3D TFM determines both horizontal (dh) and vertical (dv) components of the displacement vector (d), allowing the calculation of a 3D traction force vector. (G) A breast tumor cell (yellow, MDA-MB-231 cell line) is embedded in 3D type I collagen matrix, visualized by reflective confocal images (cyan). (H) 3D rendering images of bead displacements (blue) and cells (magenta) in 3D collagen matrix. *Figures adapted with permission from; Fig. 1A, B: ref. (32, Fig. 1C, D: ref. (36, Fig. 1E, F: ref. (40, Fig. 1G, H: ref. (44).

