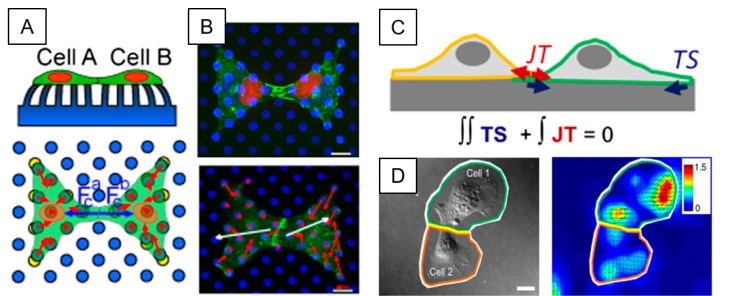
Fig. 2.
Intercellular junctional force quantification by IFM. (A) Schematic diagram 2D IFM by micropillars for a pair of endothelial cells at cell-cell junctional interfaces. For a doublet of contacting cells, the net force encompasses both traction force Ti (red arrows) and the intercellular force Fc, (blue arrows). Cell-cell junction or intracellular force Fc plotted over cell A is defined as the net tugging force that cell A is exerting on cell B at the cell-cell junctional interface. Cell B is expected to pull on cell A with an equal amount of opposite force. (B) Cells adhered onto microposts are constricted to have a shape of a bowtie pattern by micropatterned of fibronectin (Cyan) (top). Arrows present the force vectors with direction and magnitude (bottom). Red arrows show individual traction forces and white arrows exhibit tugging force between two cells. (C) 3D IFM by a deformable substrate. Schematic of two cells on a substrate with traction stress TS (blue arrows) and cell-cell tension JT (red arrows). Cell-cell and intracellular forces are determined in 3D by the force balance on the ground of Newton's first law. (D) A phase contrast image of a pair of endothelial cells in contact (left) and corresponding contour and vector map of displacement of two endothelial cells (right). *Figures adapted with permission from ref. (51) for Fig. 2A, B and from ref. (47) for Fig. 2C, 2D.

