Figure 2.
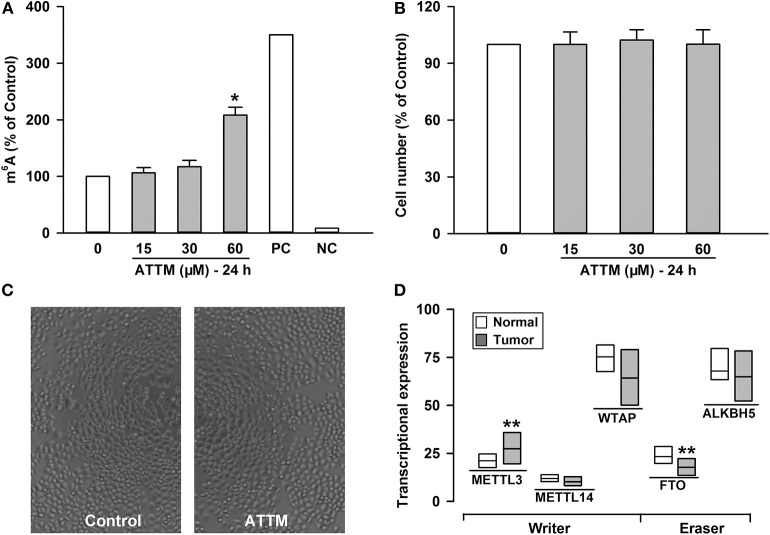
Effects of ATTM on mRNA m6A methylation in A549 cells. The cells were treated with ATTM at concentrations ranging from 0 to 60 μM for 24 h. (A) The content of m6A mRNA was measured with a commercial kit (PC, positive control; NC, negative control). (B) The cell number was tested with CCK-8 assay. Data are presented as mean ± SD. n = 4. *P < 0.01 vs. Control group. (C) Growth of quiescent A549 cells and cells exposed to 60 μM ATTM for 24 h were captured using digital microphotograph. (D) Expressions of the m6A writers (METTL3, METTL14, and WTAP) and erasers (FTO and ALKBH5) were analyzed between LUAD primary tumor tissues (n = 515) and normal tissues (n = 59) in TCGA cohort. Data are showed as median ± quartile. **P < 10−4 vs. Normal tissues.

