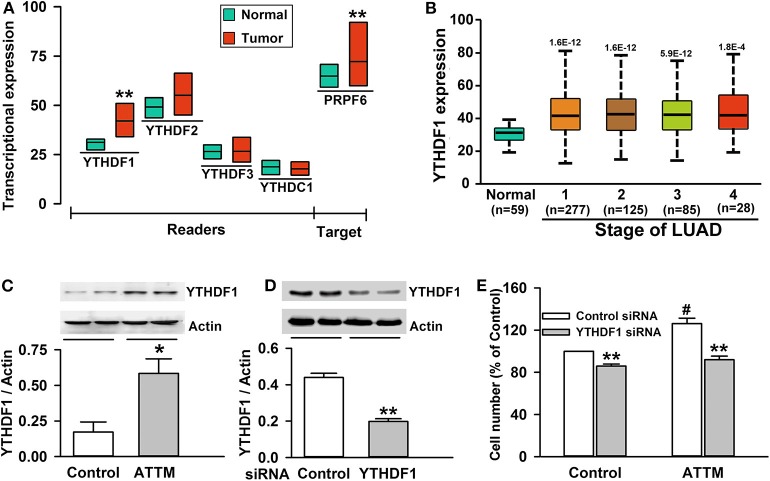
Figure 4.
Roles of YTHDF1 in ATTM-induced growth of A549 cells. (A) Expressions of m6A readers (YTHDF1, YTHDF2, YTHDF3, and YTHDC1) and a potential target gene (PRPF6) were compared between LUAD patient primary tumor tissues (n = 515) and normal tissues (n = 59) in TCGA cohort. Data are shown as median ± quartile. **P < 10−7 vs. Normal tissues. (B) YTHDF1 gene expression in normal tissues and various LUAD stage tissues was analyzed in TCGA cohort. Data are shown in the box plot. (C) After treatment of A549 cells with 60 μM ATTM for 24 h, YTHDF1 protein expression was measured with Western blot assay, and the densitometric analysis was performed. Data are shown as mean ± SD. n = 2. *P < 0.05 vs. Control group. (D) A549 cells were incubated with YTHDF1 siRNA or Control siRNA for 6 h followed by a 24-h culture, and the interference efficiency was determined with Western blot assay. (E) Normal A549 cells and YTHDF1-knocked down cells were treated with 60 μM ATTM for 48 h, and cell counting assay was performed. Data are presented as mean ± SD. n = 4. **P < 0.01 vs. Control siRNA cells, #P < 0.01 vs. ATTM-free cells.

