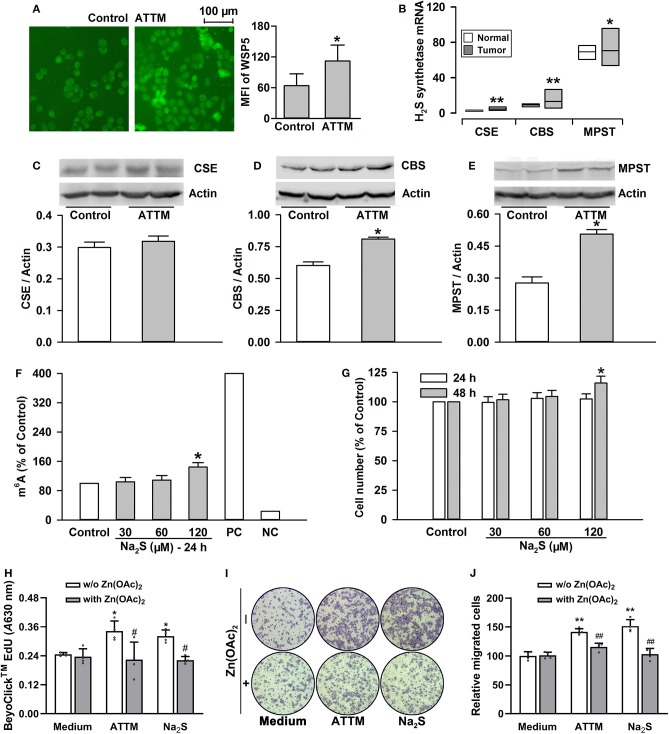
Figure 6.
Roles of H2S in ATTM-induced m6A methylation and growth in A549 cells. (A) A549 cells were treated with normal medium (Control) and 60 μM ATTM for 3 h. Intracellular H2S content was observed with H2S fluorescent probe WSP5 staining followed by fluorescence photography. (B) Expressions of H2S synthetases (CSE, CBS and MPST) were compared between LUAD patient primary tumor tissues (n = 515) and normal tissues (n = 59) in TCGA cohort. Data are showed as median ± quartile. *P < 10−6, **P < 10−11 vs. Normal tissues. (C–E) After treatment of A549 cells with 60 μM ATTM for 24 h, the expressions of CSE (C), CBS (D), and MPST (E) were measured with Western blot, and then densitometric analysis were performed. Data are shown as mean ± SD. n = 2. *P < 0.05 vs. Control. (F) A549 cells were treated with increasing concentrations of Na2S for 24 h, intracellular m6A mRNA was tested with a commercial kit. (G) A549 cells were treated with the indicated concentrations of Na2S for 24 and 48 h, respectively. The cell number was measured with CCK-8 assay. (H–J) A549 cells were treated with 60 μM ATTM or 120 μM Na2S in the absence or presence of 25 μM Zn(OAc)2 for 48 h. Cell proliferation was tested with EdU incorporation assay (H). Cell invasion was observed with Transwell Migration Assay (I) and migrated cells were counted using ImageJ software. Data are presented as the mean ± SD. n = 4. *P < 0.05, **P < 0.01 vs. Control/Medium. #P < 0.05, ##P < 0.01 vs. Zn(OAc)2 free group.

