Figure 4.
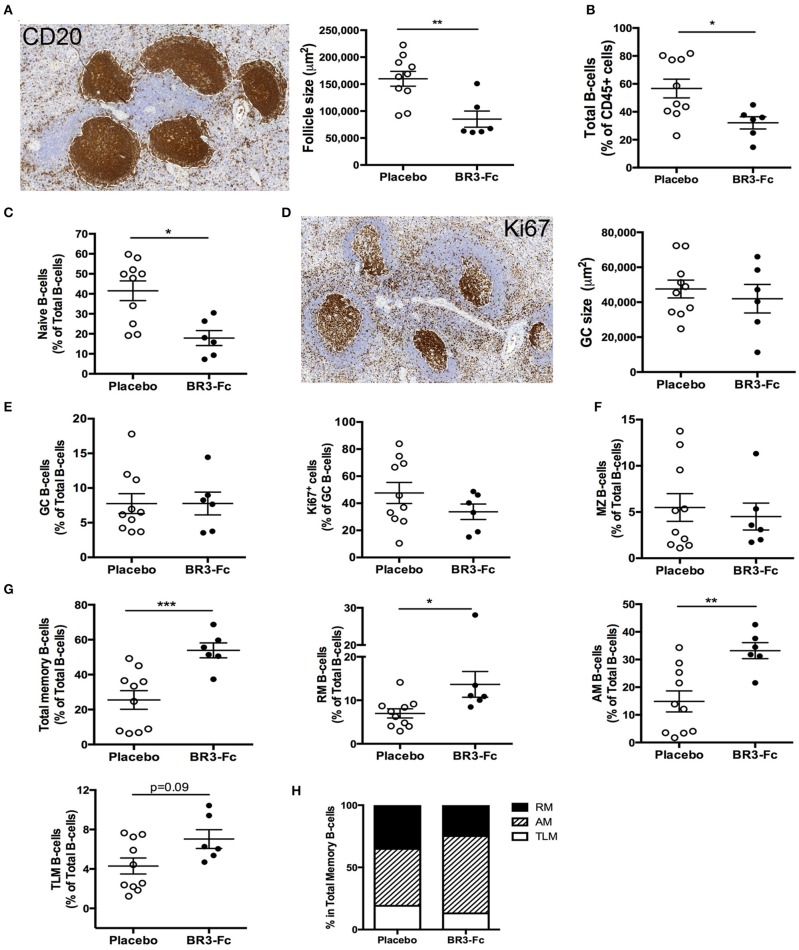
Higher proportions of activated memory B-cells in spleen and changes in BAFF receptor expression after BR3-Fc treatment. (A) Representative CD20 staining (left) on sections of spleen from one Placebo macaque. For each section, the size of all follicles was determined using Pannoramic Viewer software. Average size of follicles for each macaque was shown (right panel). (B) Proportions of total spleen B-cells (CD19+CD20+) in CD45+ cells were determined by multi-parameter FCM for each macaque. (C) Proportions of naïve B-cells among total B-cells were determined by multi-parameter FCM for each macaque according to the gating strategy shown in Figure S3. (D) Representative Ki67 staining (left) on sections of spleen from one Placebo. The average size of GC was determined using Pannoramic Viewer software for each macaque (right panel). (E) Proportions of GC B-cells in total B-cells (left panel) and of Ki67+ cells among GC B-cells (right panel) in spleen cell suspensions. (F) Proportions of MZ B-cells in total B-cells from spleen cell suspensions; (G) proportions of total, RM, AM, TLM memory B-cells in total B-cells from spleen cell suspensions; (H) graphs represent the relative frequencies of RM (black), AM (hatched) and TLM (white) B-cell subsets among total memory B-cells for each group of macaques. For (A–G), each dot represents one macaque of Placebo (open circle) or Treated (black circle) group. Bars represent Mean ± SEM. Statistical comparison between groups was performed using Mann Whitney non-parametric test. Significant statistical values are indicated: *p < 0.05, **p < 0.01, and ***p < 0.001.

