
Figure 3.
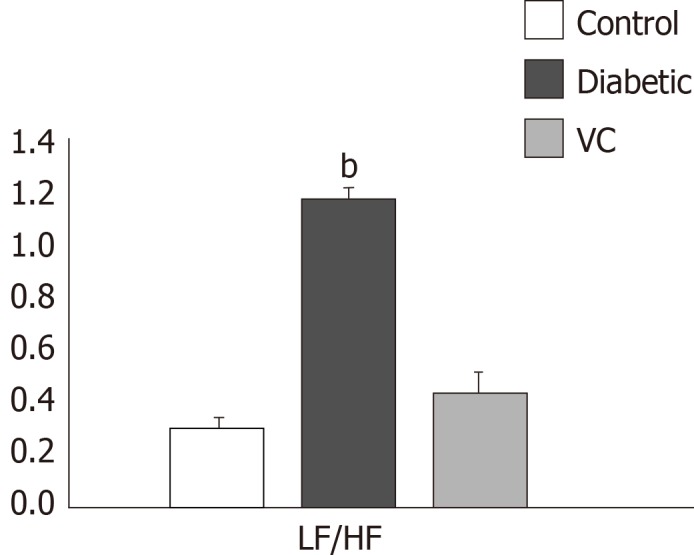
Sympathovagal balance of diabetic and vitamin C treated rats. Results are presented as mean ± SE, n = 10; bP < 0.001 significantly different from control. LF: Low frequency; HF: High frequency.
Official websites use .gov
A
.gov website belongs to an official
government organization in the United States.
Secure .gov websites use HTTPS
A lock (
) or https:// means you've safely
connected to the .gov website. Share sensitive
information only on official, secure websites.
Sympathovagal balance of diabetic and vitamin C treated rats. Results are presented as mean ± SE, n = 10; bP < 0.001 significantly different from control. LF: Low frequency; HF: High frequency.