
Figure 2.
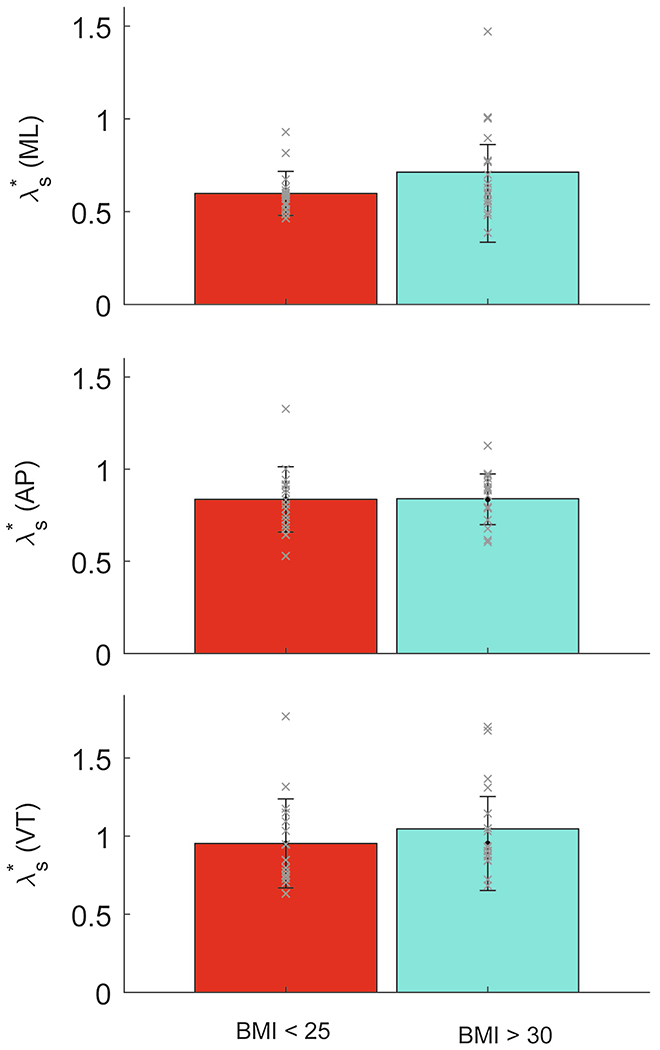
Mean values of λs* for participants without obesity (BMI: 18.5-24.9 kg/m2) and participants with obesity (BMI: ≥30 kg/m2) are shown for the medial-lateral (ML: top), anterior-posterior (AP: middle), and vertical (VT; bottom) directions. Individual data are shown as ‘x’. Error bars are one standard deviation across subjects about the mean. There were no significant differences in stability between the normal-weight and obese groups in any planes of motion.