
Figure 4.
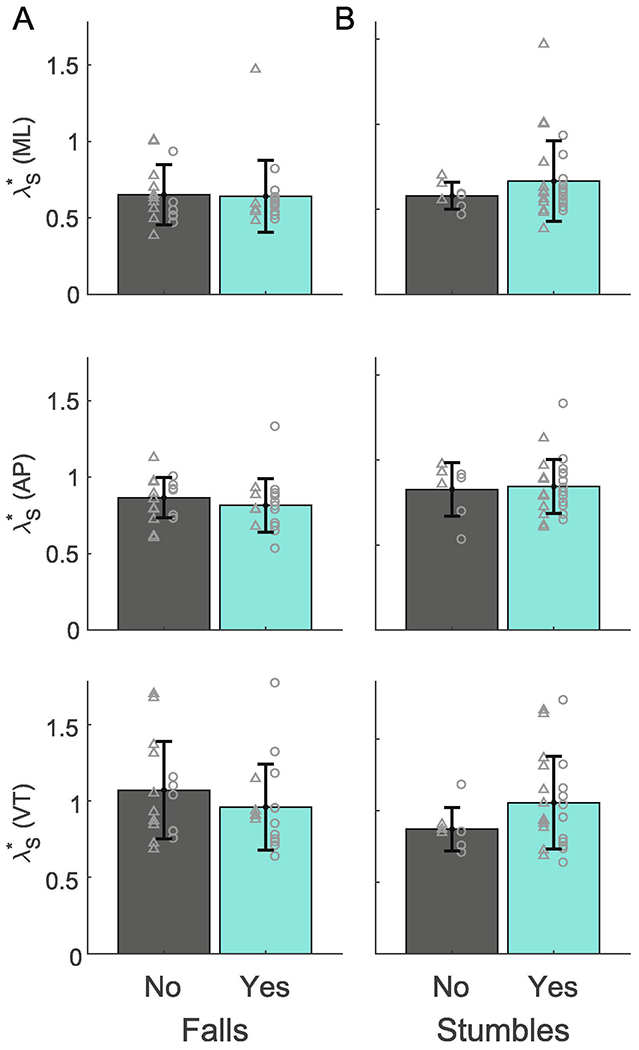
Mean values of λs* for people with prospective falls and those without prospective falls (A) and stumblers and non-stumblers (B) are shown for the medial-lateral (ML: top), anterior-posterior (AP: middle), and vertical (VT: bottom) directions. Error bars are one standard deviation across subjects about the mean. There were no significant differences in stability between groups.