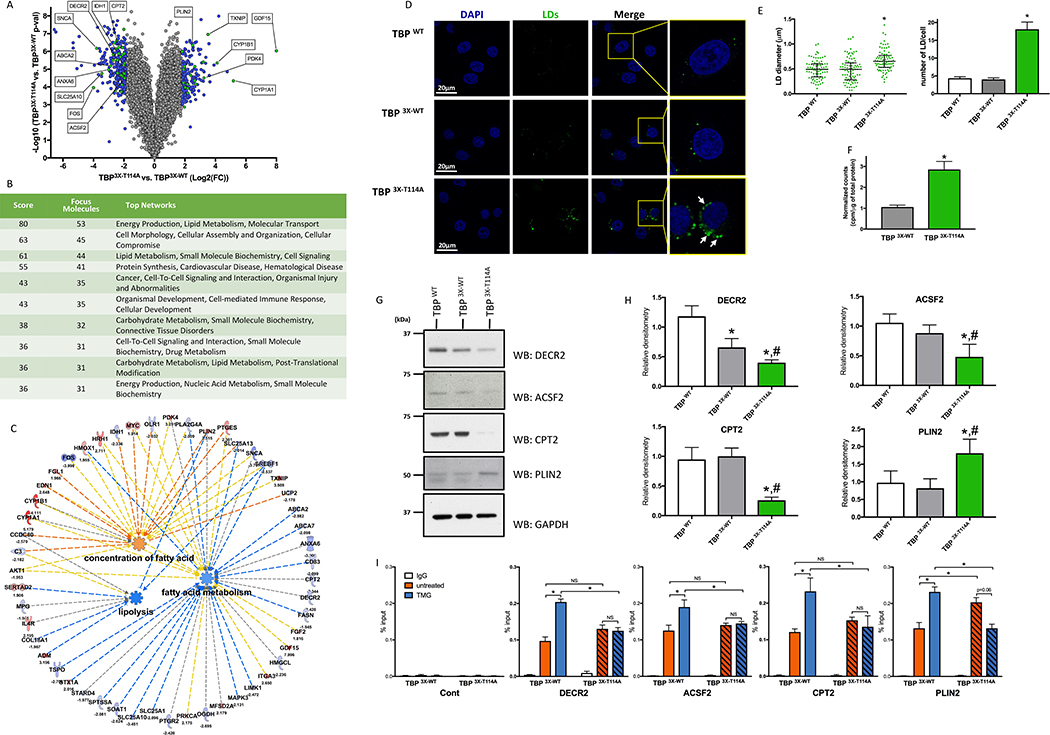
Figure 2: Mutation of the TBP T114 O-GlcNAc site leads to profound metabolic genes reprogramming and triggers accumulation of lipid droplets.
(A) Volcano plot of mRNA transcript differentially express between TBP 3X-T114A and TBP 3X-WT cells. Blue and Green dots represent genes with fold change < −2 or > 2 SD and with a p-value < 0.05. Green dots are the top 5 dysregulated genes from Figure 2C and selected targets showed in Figure 2G and 2H.
(B) Network enrichment in TBP 3X-T114A cells.
(C) IPA representation showing prediction function pathway of lipolysis, FA concentration and metabolism. Pathways identified based on 22 molecules with a p = 7.99×10⁻⁵, 9 molecules with a p = 0.001 and 39 molecules with a p = 3.07 ×10⁻⁵ respectively.
(D) HeLa cells LD content under HG.
(E) Quantitative analysis of the LDs size (left panel) and number per cell (right panel) of the HeLa TBP WT cell line and its edited counterparts. LDs size data are median with interquartile range (n=3, total of 83 LDs were measured). Number of LDs per cell are mean ± SEM (n=3, total of 30 cells). *p<0.05 compared to both control cell lines.
(F) FA synthesis rate in TBP 3X-WT and TBP 3X-T114A cells. Data are mean ± SD, n=6, *p<0.05.
(G) Protein levels of key mRNAs that were differentially expressed in TBP 3X-T114A compared to TBP 3X-WT and TBP WT cell lines.
(H) Densitometry analysis of immunoblots showed in Figure 2G. Data are mean ± SD, n ≥ 3, *p < 0.05 compared to TBP WT, #p < 0.05 compared to TBP 3X-WT.
(I) DECR2, ACSF2, CPT2 and PLIN2 promoter occupancy of TBP 3X-WT and TBP 3X-T114A under LG treated or not with TMG. Data are mean ± SEM, n=3, *p<0.05, NS: not significant.

