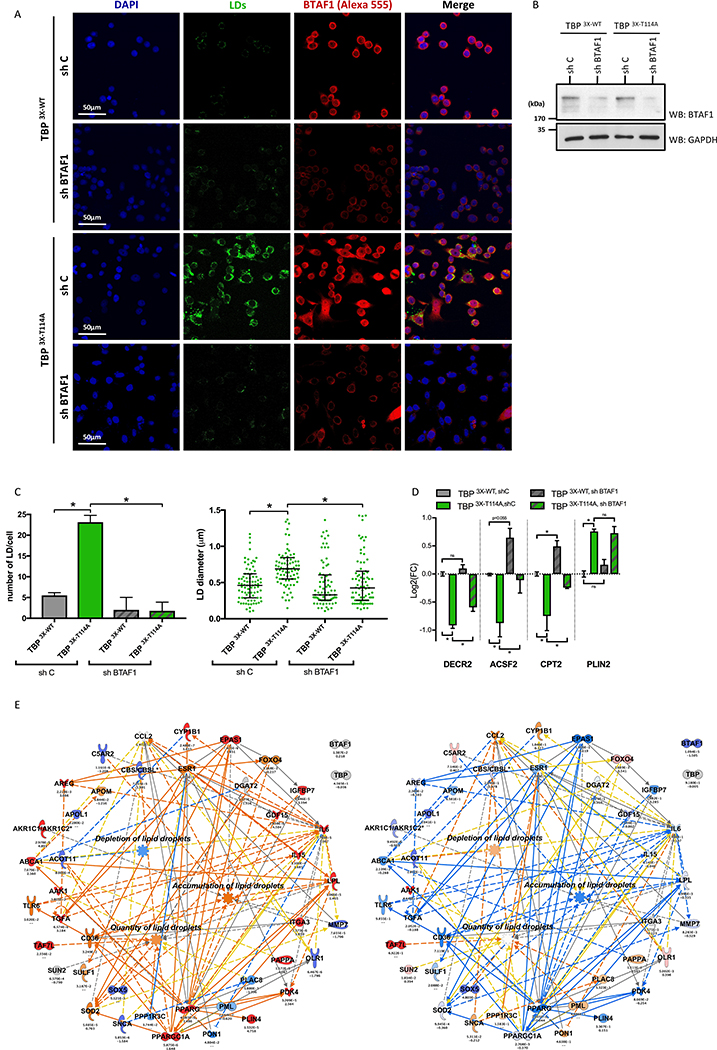
Figure 3: Downregulation of BTAF1 reverts LDs accumulation in TBP3X-T114 cells.
(A) LDs staining of indicated cell lines under HG.
(B) BTAF1 protein level in TBP 3X-WT and TBP 3X-T114A cells expressing shRNA control (sh C) or shRNA BTAF1 (sh BTAF1).
(C) Quantitative analysis of the LD number per cell (left panel) and size (right panel) of Figure 3A. Number of LD per cell are mean ± SEM (n=3, total of 36 cells per condition) and LDs size data are median with interquartile range (n=3, total of 83 LDs were measured per condition), *p<0.05.
(D) Gene expression level of DECR2, ACSF2, CPT2 and PLIN2 in indicated cell lines. Data are expressed in Log2(FC) compered to TBP 3X-WT,shC cells and shown as mean ± SEM, n=3, *p<0.05, NS: not significant.
(E) IPA representation showing upregulation prediction function pathway of accumulation, quantity and depletion of LDs. Prediction made using transcriptomic data set of TBP 3X-T114A,shC vs. TBP 3X-WT,shC (left panel) and TBP 3X-T114A,shBTAF1 vs. TBP 3X-T114A,shC (right panel).

