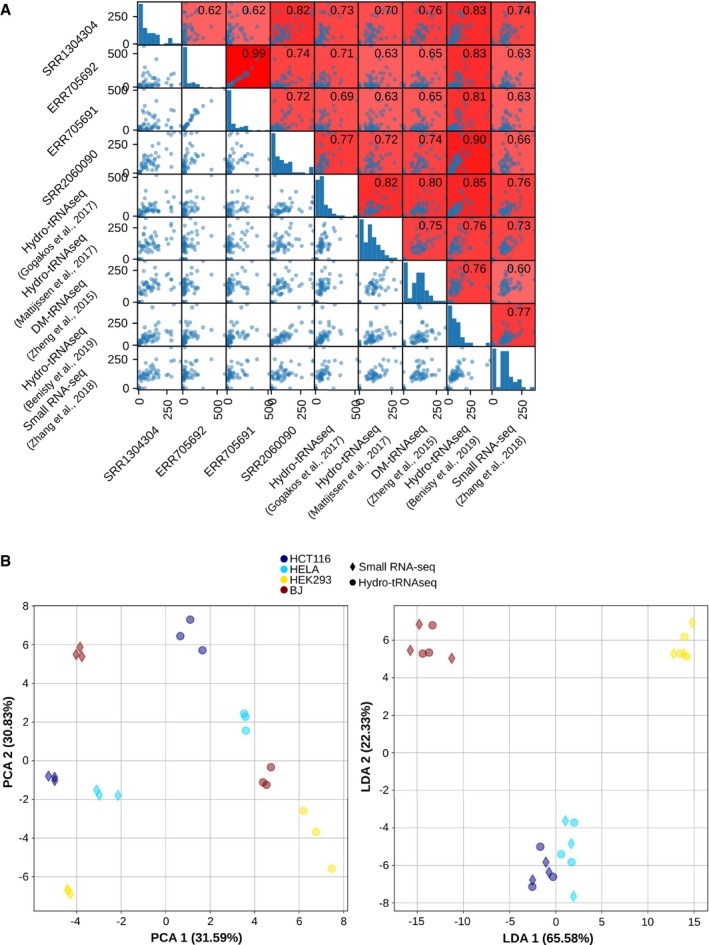
Figure EV1. Correlations between small RNA‐seq and hydro‐tRNAseq protocols, related to Fig 1 .

- The Spearman correlations between all HEK293 tRNA quantifications, including four small RNA‐seq datasets (Data ref: Flores et al, 2014b; Data ref: Mefferd et al, 2015b; Data ref: Torres et al, 2015b,c), four well‐established tRNAseq datasets using Hydro‐tRNAseq and DM‐tRNAseq (Data ref: Zheng et al, 2015b; Data ref: Gogakos et al, 2017b; Data ref: Mattijssen et al, 2017b; Data ref: Benisty et al, 2019b), and one previously published quantification from small RNA‐seq data by Zhang et al (2018). The scatter plots are square‐root‐normalized for better visualization.
- Principal component analysis (PCA) and linear discriminant analysis (LDA) of all absolute tRNA quantifications of HCT116, HELA, HEK293, and BJ fibroblasts, both from small RNA‐seq and from Hydro‐tRNAseq data. On the left, the first component of the PCA (method‐related) explains 31.59% variance and the second component (cell‐line‐related) explains 30.83% variance. On the right, the first component of the LDA separates completely all four cell lines, regardless of the method.
