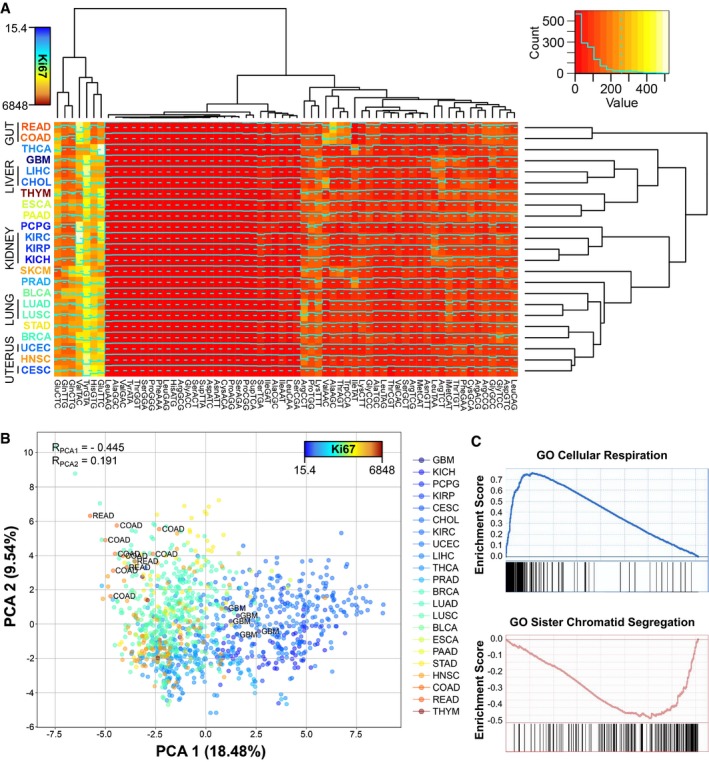
Medians of square‐root‐normalized tRNA abundances across all TCGA tissues. The color of the tissue labels corresponds to the average Ki67 expression. Refer to
Table EV4 for full cancer type names and number of samples.
Principal component analysis (PCA) of the relative anticodon abundances (RAA, see
Materials and Methods) of all healthy samples of TCGA, where the color scale corresponds to the mean tissue expression of Ki67. The Spearman correlations of Ki67 with the components are shown, as well as the samples of most extreme tissues.
Top positive and negative GO terms upon gene set enrichment analysis (GSEA) of the correlations of the first PCA component against all genes.
Data information: Abbreviations stand for BLCA (bladder urothelial carcinoma), BRCA (breast invasive carcinoma), CESC (cervical squamous cell carcinoma and endocervical adenocarcinoma), CHOL (cholangiocarcinoma), COAD (colon adenocarcinoma), ESCA (esophageal carcinoma), GBM (glioblastoma multiforme), HNSC (head and neck squamous cell carcinoma), KICH (kidney chromophobe), KIRC (kidney renal clear cell carcinoma), KIRP (kidney renal papillary cell carcinoma), LIHC (liver hepatocellular carcinoma), LUAD (lung adenocarcinoma), LUSC (lung squamous cell carcinoma), PAAD (pancreatic adenocarcinoma), PCPG (pheochromocytoma and paraganglioma), PRAD (prostate adenocarcinoma), READ (rectum adenocarcinoma), SKCM (skin cutaneous melanoma), STAD (stomach adenocarcinoma), THCA (thyroid carcinoma), THYM (thymoma), UCEC (uterine corpus endometrial carcinoma).

