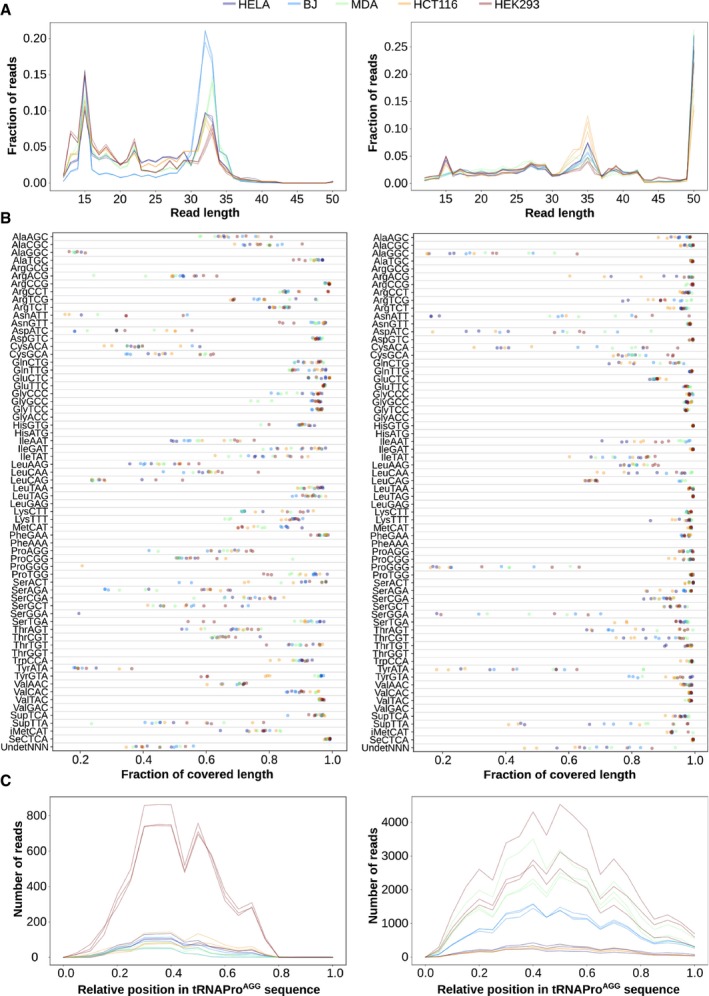
Figure EV2. Comparison between raw sequencing data from small RNA‐seq (left) and Hydro‐tRNAseq (right), related to Fig 1 .

- Length distribution of all reads mapping to tRNA genes.
- Fraction of the tRNA sequence that is covered by 1 or more reads, for each of the tRNA isoacceptors.
- Absolute number of reads mapping along the sequence of tRNAProAGG. The relative abundance between cell lines is not comparable given their different sequencing depths.
