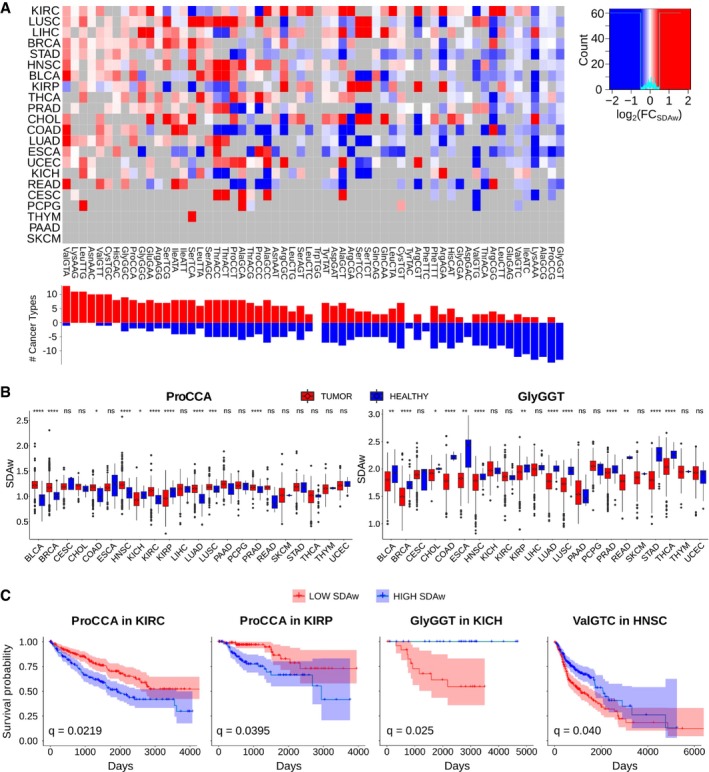
Figure 4. Aberrant translational efficiencies drive tumor progression.

- Differential SDAw between healthy and tumor samples across 22 cancer types, as measured by log2(SDAwTumor/SDAwHealthy). Only significant differences are colored, which are determined using a two‐tailed Wilcoxon rank‐sum test and corrected for multiple testing by FDR. Refer to Table EV4 for full cancer type names and number of samples.
- Boxplot of the SDAw of ProCAA and AlaGCG codons across TCGA cancer types. Boxes expand from the first to the third quartile, with the center values indicating the median. The whiskers define a confidence interval of median ± 1.58*IQR/sqrt(n). Statistical differences are determined using a FDR‐corrected two‐tailed Wilcoxon rank‐sum test ns (P > 0.05), * (P ≤ 0.05), ** (P ≤ 0.01), *** (P ≤ 0.001), **** (P ≤ 0.0001).
- Survival curves for the previous codons in KIRC, KIRP, and BLCA patients. The survival analysis was performed for all codons whose SDAw were significantly different in more than 5 cancer types in the one direction with respect to the other [Abs(UP‐DOWN) > 5] and correspondingly corrected for multiple comparisons using FDR.
