
Figure EV5. Differential expression of tRNAs between healthy and tumor samples across 22 cancer types, related to Fig 4 .
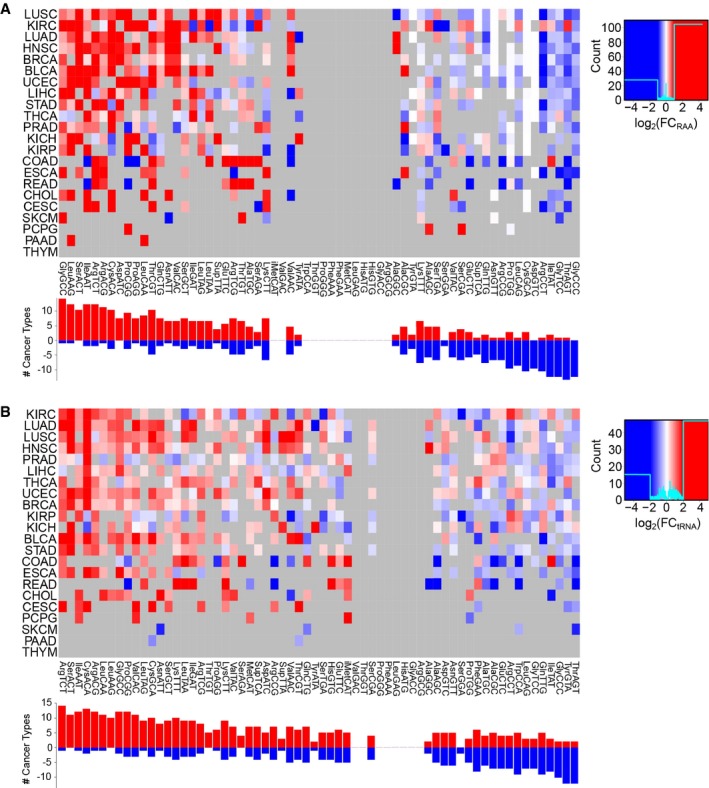
- tRNA abundance is measured as relative anticodon abundance, and the fold change is log2(RAATumor/RAAHealthy). Refer to Table EV4 for full cancer type names and number of samples.
- Absolute tRNA differential abundance by log2(tRNATumor/tRNAHealthy). Only significant differences are colored, which are determined using a two‐tailed Wilcoxon rank‐sum test and corrected for multiple testing by FDR.