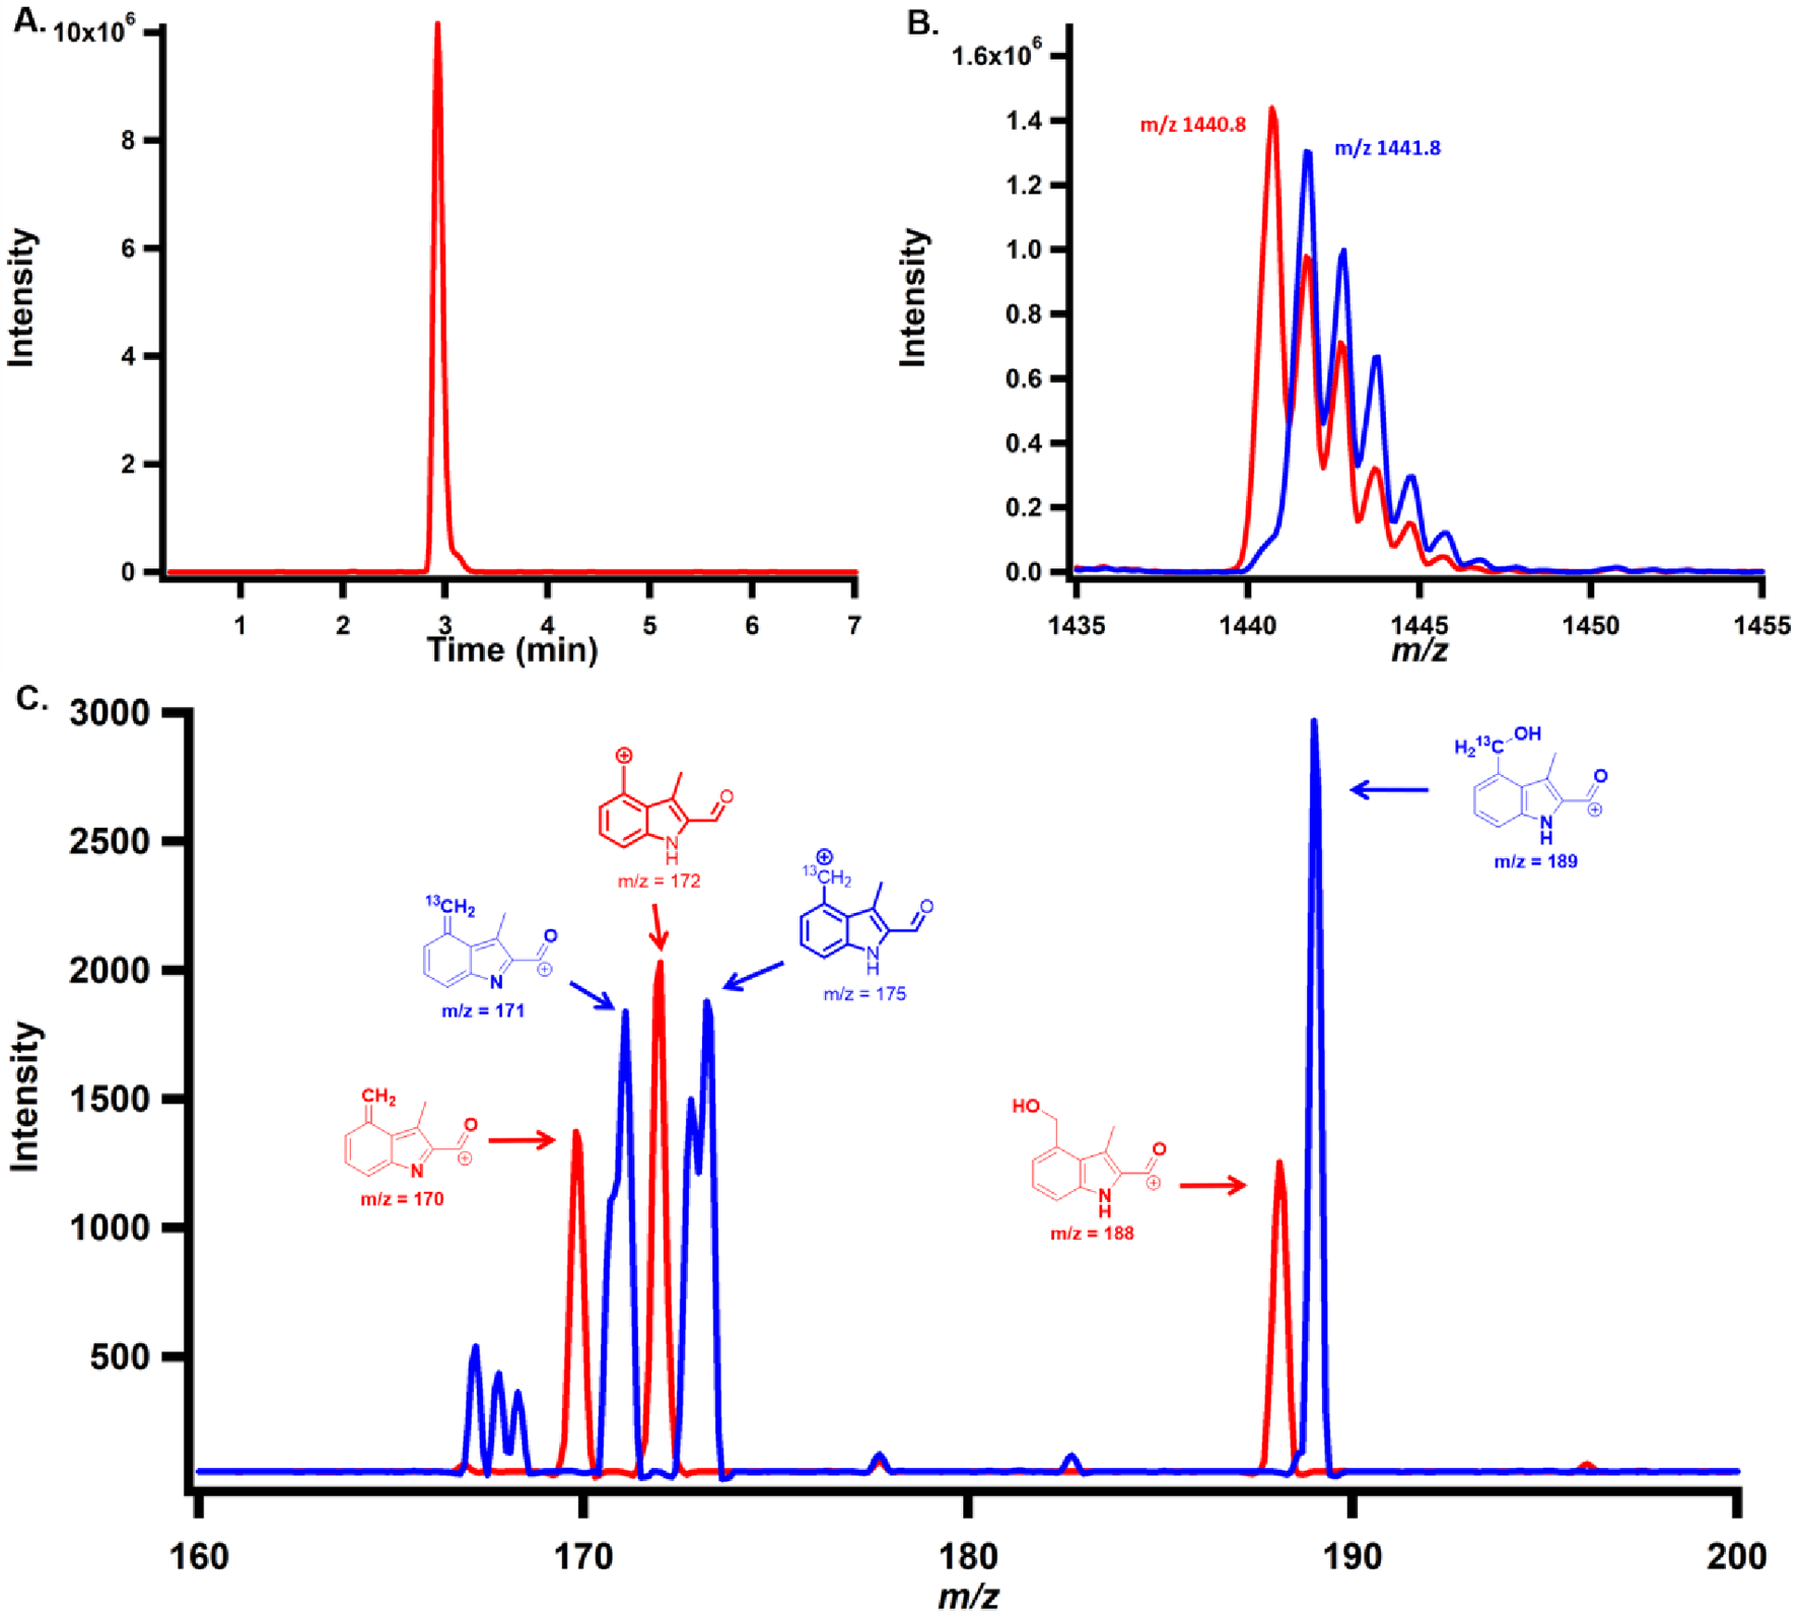
Figure 4.

A) Chromatogram displaying the single-ion monitoring (SIM) of the dominant product formed when 1 mM compound 7 is incubated with 1 mM SAM, 50 μM NosN and 2 mM Ti(III) citrate for 1 h. B) MS spectrum of NosN product of compound 7 using SAM (red trace) or [13C methyl]SAM (blue trace). C) MS/MS analysis of NosN product of compound 7 using SAM (red trace) or [13C methyl]SAM (blue trace).
