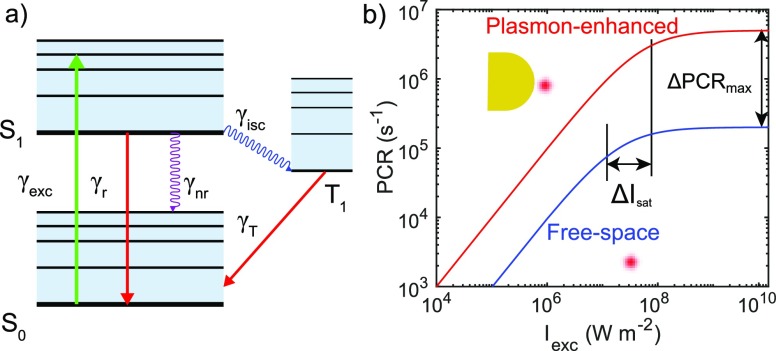
Figure 1.
Photophysics of a single emitter modified by a plasmonic nanoantenna. (a) A three-level Jablonski diagram for a single fluorescent molecule. (b) Cartoon of saturation curves of an emitter in free space (blue) and in the vicinity of a plasmonic nanoantenna. Both the saturation intensity (Isat) and the maximum photon count rate (PCRmax) are modified. Note here that this figure is for illustrative purposes and is not a simulation result.

