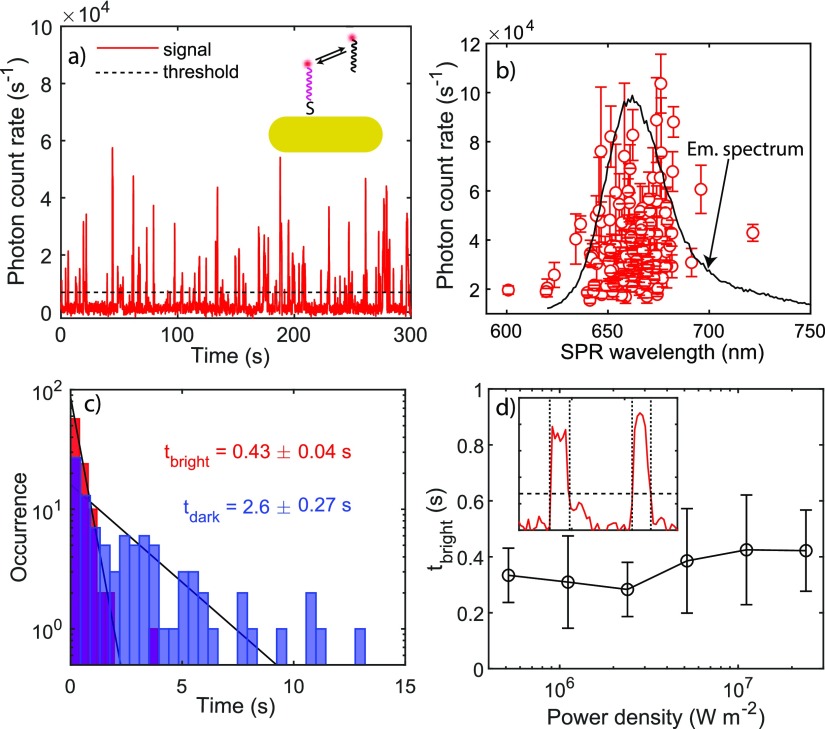
Figure 4.
Fluorescence time traces and correlation with SPR wavelengths of single AuNRs. (a) Fluorescence time trace showing single imager strands binding to single AuNRs. This AuNR’s SPR wavelength is determined to be 661 nm. (b) SPR wavelengths of ∼130 single AuNRs correlated with the mean photon count rates of the 10 brightest events. The error bars indicate the standard deviation of the count rates. (c) Dark and bright time distributions of imager binding. (d) Mean bright times as a function of power density. The error bars indicate the standard deviation of mean bright times collected from up to 100 single nanorods. The inset illustrates the determination of bright times from on a fluorescence time trace.

