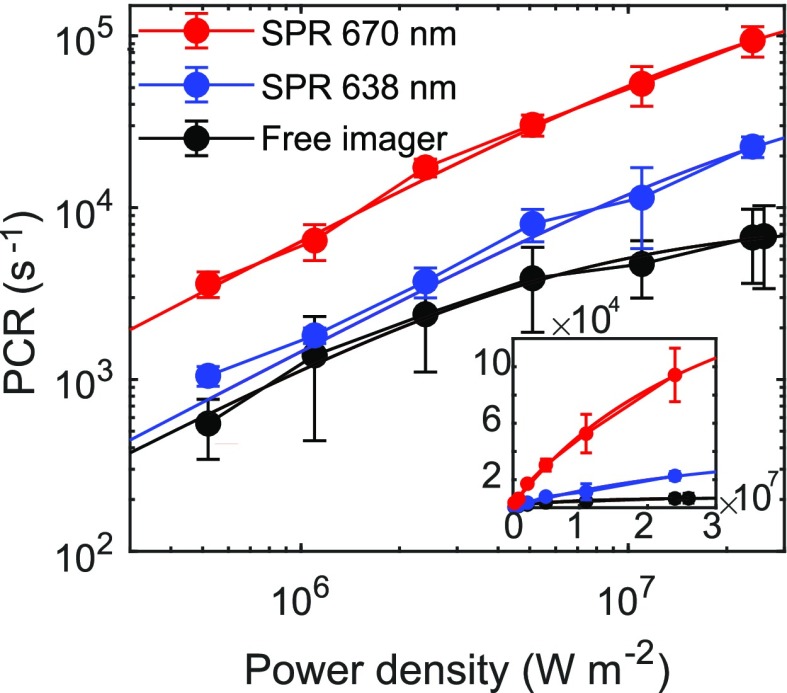
Figure 5.
Saturation curves of plasmon-enhanced and nonenhanced single-molecule fluorescence. Inset shows the same saturation curves on a linear scale. The saturation intensity of free imagers is determined to be Isat0 = 6.4 × 10⁶ W m–2, and maximum PCR at saturation PCRmax = 8.3 × 10³ s–1. For the particle with a SPR of 670 nm, PCRmax670 = 2.3 × 10⁵ s–1 and Isat = 3.5 × 10⁷ W m–2. For the particle with a SPR of 638 nm, PCRmax638 = 5.9 × 10⁴ s–1 and Isat = 3.9 × 10⁷ W m–2.

