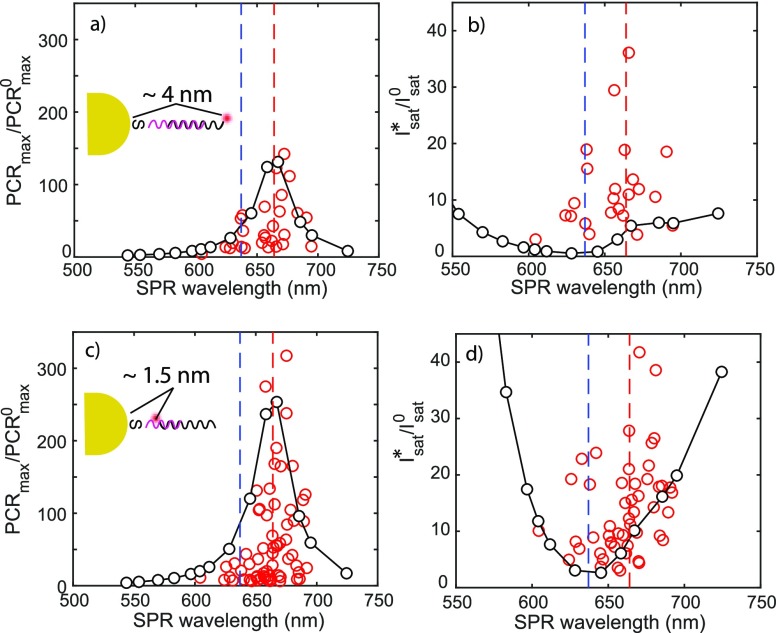
Figure 6.
(a and b) Modified PCRmax and Isat of plasmon-enhanced fluorescence for AuNRs coated with
30 nt docking strands (4 nm spacing) and (c and d) for AuNRs
coated with 15 nt docking strands and near-end labeled imager (1.5 nm
spacing). Note here that the simulated Isat* is normalized
to the near-field intensity at the position of the fluorophore to
be able to display both the measured and simulated values on the same y-axis, i.e.,  . In all graphs, red dots are experimental
data points, and black dots are simulation results with lines as a
guide to the eye. R2 values are used to
evaluate the fitting quality, and only curves with R2 >0.995 are plotted. See the Supporting Information for full simulation details including the decay
rates used in the simulations.

