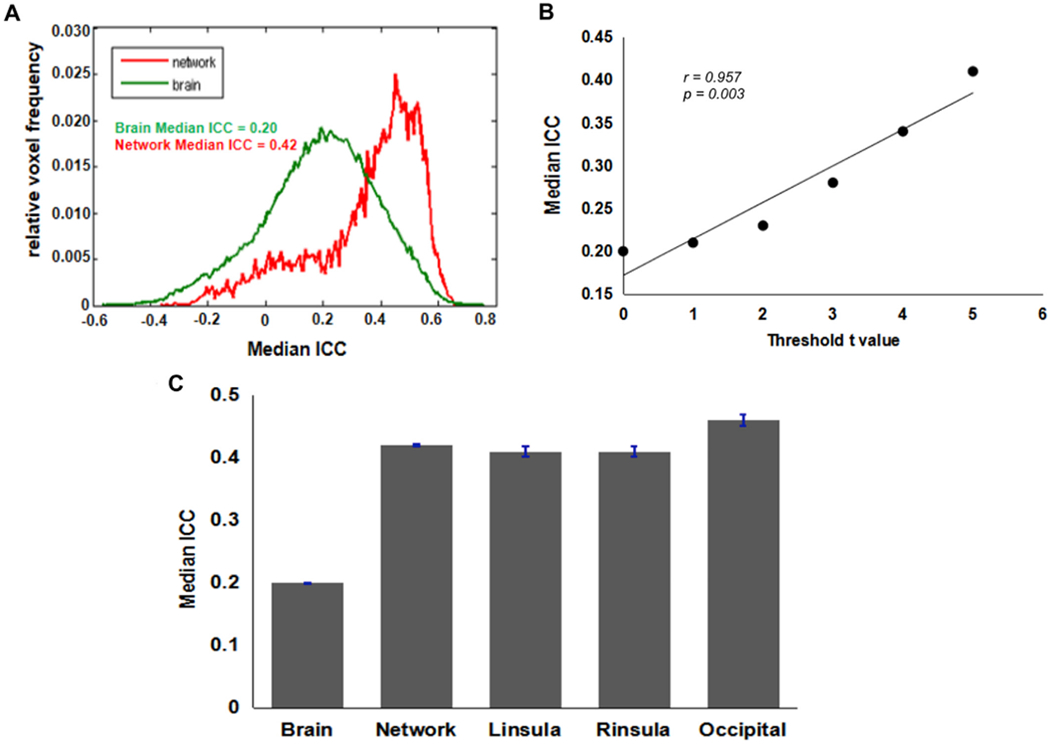
Fig. 6. Test-retest reliability of BART activation associated with loss outcomes.

(A) ICC frequency distribution for the whole-brain (Green line) and for the voxels in the activated network (Red line). The brain activation results from the first test session were used to define the “activated network” here. Voxels were classified as active if they had t-values t > 3.36 (corresponding to p < 0.001). (B) Positive correlation between median ICC and threshold t-scores. (C) Median ICC values for the whole-brain, activated network, and ROIs.
