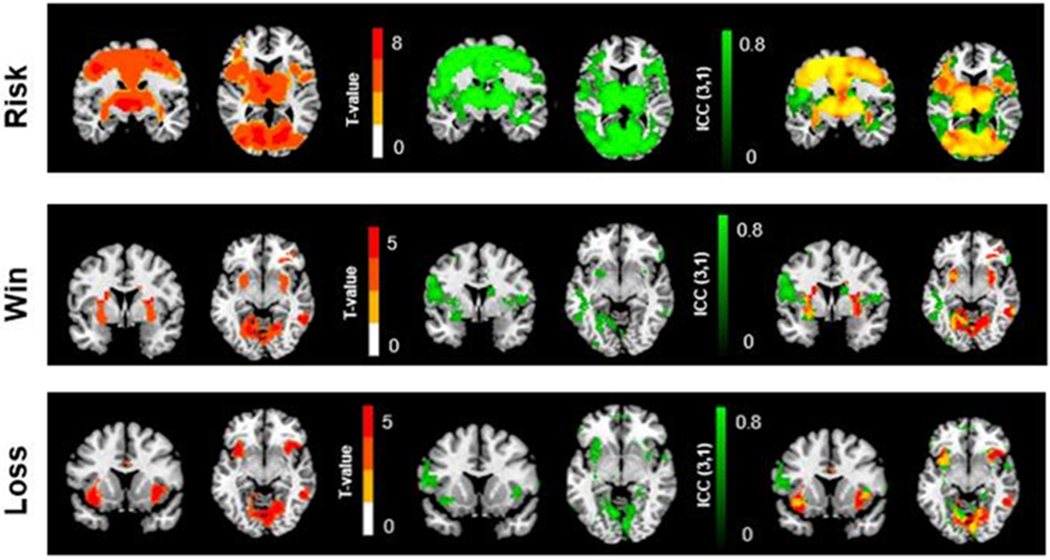
Fig. 7. Overlaps between ICC maps and group t-maps.

Top: Brain activation associated with increased risk levels. Middle: Brain activation in response to win outcomes. Bottom: Brain activation in response to loss outcomes. Left-Red: Group t-maps (t > 3.36 for risk; t > 3.36 for win; t > 3.36 for loss. Thresholding of t-values corresponding to p = 0.001). Middle-Green: ICC (3,1) maps (ICC > 0.5). Right-Yellow: Overlapping regions between group t-maps and ICC maps.
