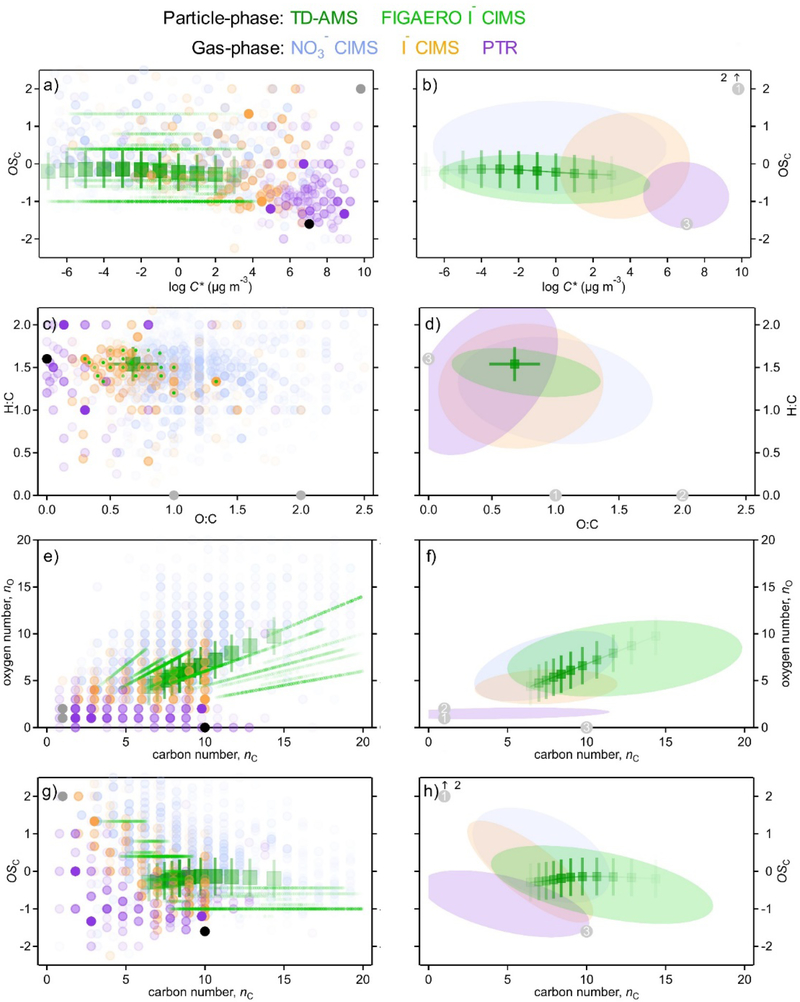
Figure 1.
Reduced parameter frameworks populated by ions observed in the sample mixture (α-pinene photolysis products). Left: individual ions as circles, with opacity correlated with fraction of measured instrument mass. Right: ovals that contain 80% of measured instrument mass (optimized as smallest area ellipse that meets this criteria). Four frameworks are shown: (a,b) oxidation state by volatility; (c,d) hydrogen to carbon ratio by oxygen to carbon ratio; (e,f) oxygen number by carbon number; and (g,h) oxidation state by carbon number. In all panels, particle phase measurements shown are the bulk average measurements from the TD-AMS, binned into 10 bins (dark connected green markers) with approximate range shown as error bars based on uncertainty and known constituents, and the FIGAERO I− CIMS (light green oval and dots), using nC,calc estimated from measured volatility. Gas phase measurements shown are from the NO3− CIMS (light blue), I− CIMS (orange), and PTR (purple). Carbon monoxide and dioxide, not measured by these mass spectrometers, are shown in gray and numbered as 1 and 2, respectively, with precursor α-pinene numbered as 3.

