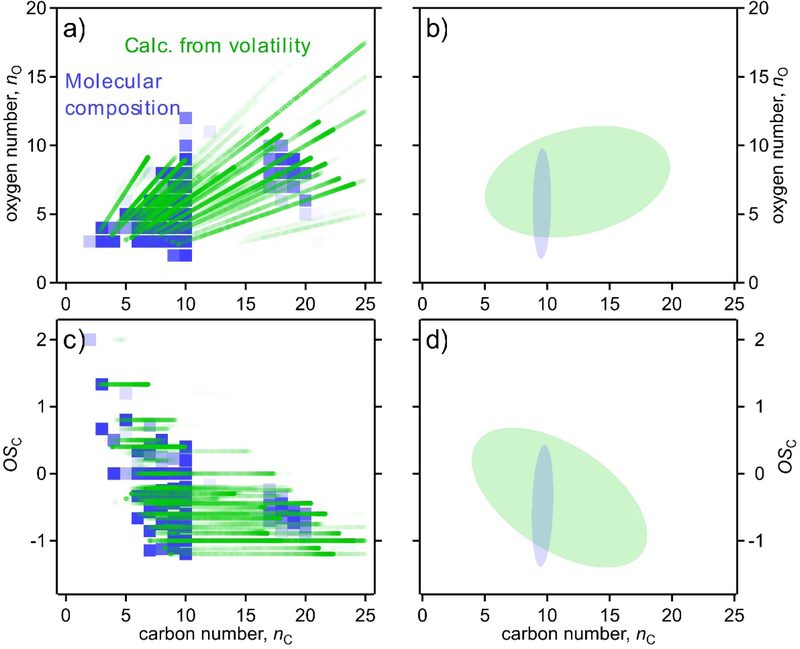
Figure 3.
Comparison of distribution of FIGAERO I− CIMS in two frameworks: (a,b) oxygen number by carbon number, and (c,d) oxidation state of carbon by carbon number. Directly measured parameters from molecular formulas (nC,nO) are blue (squares). Parameters calculated from volatility based on Eqs. 2 and 4 (nC,calc,nO,calc) are green (dots). Left: individual ions shown, opacity proportional to measured mass. Right: ovals that contain 80% of measured instrument mass (optimized as smallest area ellipse that meets this criteria).

