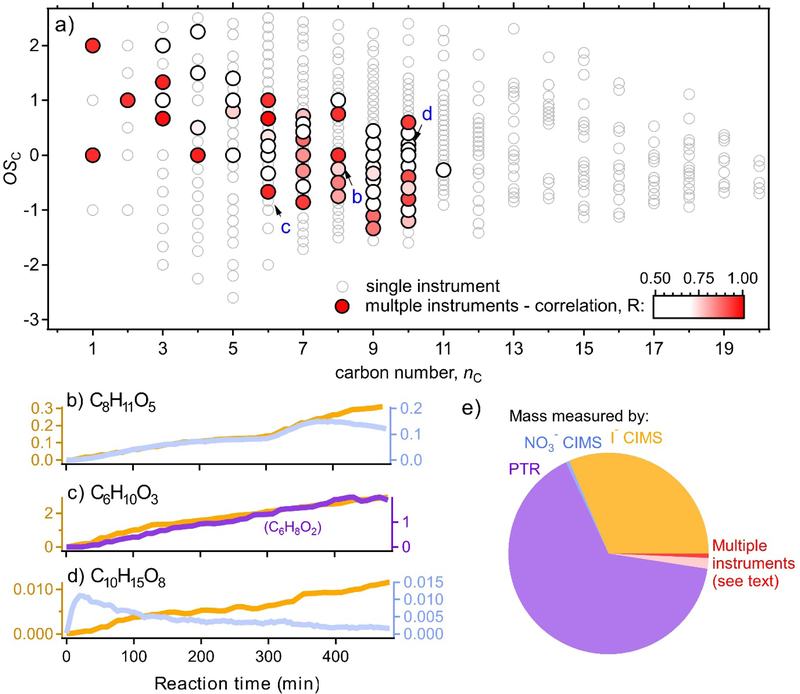
Figure 4.
(a) Distribution of all measured gas-phase ions in the oxidation state by volatility framework. Ions measured by a single instrument a hollow light grey circles Ions that are measured by multiple instruments shown as larger solid circles colored by correlation (r) between ion measured by each instrument; red: same molecular formula, blue: PTR formula is dehydrated molecular formula of other instrument. Three examples of ions measured by two instruments are labelled and shown as (b), (c), and (d), colored as in Fig. 1 and (e), pie chart of measured mass of each gas-phase instrument. Mass potentially measured by multiple instruments in red (dark red: both instruments have same formulas; pink: PTR formula is dehydrated I− CIMS formula); all overlapping ions included regardless of correlation coefficient, so represents the upper limit of overlap.

